Download
1 / 21
220 likes | 401 Views
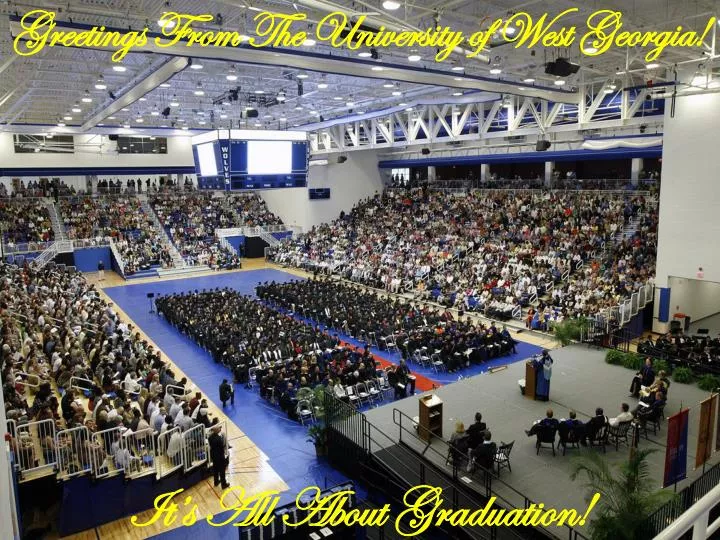
Greetings From The University of West Georgia!. It’s All About Graduation!. Graduation!. Graduation -- at all costs; Graduation -- in spite of all obstacles; Graduation -- however long and hard the road may be;

E N D
Greetings From The University of West Georgia! It’s All About Graduation!
Graduation! Graduation -- at all costs; Graduation -- in spite of all obstacles; Graduation -- however long and hard the road may be; … for without Graduation our students miss out on all the benefits that accrue with a college degree! … Sir Willis Churchill
Presentation Points LOTS AND LOTS OF ANALYSIS! What are the Problems leading to Low Graduation Rates? How do we Know this? What are we going to do about it?
How Do We Know What the Problem Is?Graphical Analysis • Overall Retention and Graduation Rates • By Ethnicity and Gender • Comparisons with Peers • Drilling Down to Root Causes
Trends in UWG’s 6-Year Graduation Rates, Fall 1994 - 2003 cohorts
Trends in UWG’s Second-Year Retention Rates by Ethnicity and Gender %
Trends in UWG’s Six-Year Graduation Rates by Ethnicity, 2000-03 Cohorts %
UWG & Comparator Institutions: Six-Year Graduation Rates (Fall 2002 Cohort)
Retention Losses at the End of Each Year – As a Percentage of Entering Cohort
How Has UWG Performed Since 2005 in Selected Core Courses Identified (DFW Rates)? Significant change due to change in staffing philosophy—converting temporary instructor lines to permanent lecturer lines with departmental responsibility Significant change due to change in staffing philosophy— Senior Tenured faculty teach first-year course
More Analysis – With Intervention ANOVA of Graduates vs. Non-Graduates (Fall ’00 –Fall ’03 Cohorts, 6-year Graduation): • Statistically Significant Findings: • Expected Family Contribution: Higher for Graduates (measure of SES?) (p ≤ .01) • Living Arrangements: Residential Students Graduate at higher rates than Commuters (p ≤ .05) • First Term GPA: Graduates have .8 higher GPA after the first term (p ≤ .01) • Probation Status: Non-Graduates are 3-times more likely to be on Probation after their first term (p ≤ .001) • Attempted Credits in Second (Spring) Term: Graduates complete more credits in the Fall (non significant) and Spring (p ≤ .05) than Non-Graduates • Second Term GPA: Graduates have a higher GPA after Spring Term (p ≤ .01) • Critical Core Course Success: Non-Graduates failed at higher rates in ENGL 1101 and MATH 1111 in their first term (p ≤ .001 for both) • Cannot control input variables; but can reduce their effect by intervention
So, What Are the Roots of the Problem? • Analysis points to problems in the first and second year • The first term of first year is critical • An emerging institutional approach to the First Year • Failure and withdrawal rates (D, F, W) in some core courses are very high • Low Freshman Success Rate (FSR) and First Term GPAs • FSR 42.7 % in AY 2006; 51.7 % in AY 2009 • First Term GPA = 2.3
So, What Are the Roots of the Problem? (contd.) • Low course load leading to extended time to degree • Increased in Fall ’09 due to special prioritization for core courses • For those who graduated, average time to degree has been fairly constant at 12.2 semesters – even a slight change would make a big difference • Low retention and graduation rates of male students • Some policy questions: • unlimited and easy withdraw; • unlimited retakes; • low standards for academic standing; • declaration of major; restrictions on admission to major… • Campus Culture: Are retention and graduation overtly and clearly prioritized as a campus imperative – for both students and colleagues?
Evolving Culture Change • Implemented First Year For Everyone Program – 97% of all first year students are in some FYP • Higher retention rates for those in programs than not • Foundations of Excellence – Study of First year (set the stage for RPG Grant and addition of FYPs) • Early Intervention (different levels of implementation) • Predictive modeling for At-Risk Students (first term) based on pre-college characteristics – predicted 75% of outcomes • Residential; EFC, HS GPA, Race (AA is a plus), answers on New Student Profile (Finances as Barrier and Difficulty Choosing a Major) • New Student Profile -- Direct Intervention and Early Engagement • Early Withdraw Intervention (wks 2-6) • Academic Warning/Probation Intervention • Appointment with Advisor; Academic Warning seminars
Evolving Culture Change • RPG Guides: Direct retention and graduation program in each A&S department; meet with parents at Orientation • DegreeWorks: Measures progress towards degree • Academic Support Centers: Writing Ctr.; Math Lab; Biology Tutoring; EXCEL Center (tutoring, mentoring, advising) • Two-Phase Orientation (Summer and Transitions) • Second Year Experience program (Spring 2010 initial term) • First-Year Commuter program, Commuter Student Association, Commuter Lounge • Policy change: Enforced 60 hour rule – students must declare a major by their 60th hour; required intervention if not • Policy change: Increased threshold for Academic Good Standing; increased requirement for intervention (challenge/support)
Metrics • Pass rates in core courses • Pass rates lower level courses • Pass rates upper level courses • Successful course completion rates per semester (DFWI) • Average student credit hour load per semester • Freshmen success rates • Retention and Success rates by First Year Program • First- and second-year retention rates. • First-year retention rates by First Year Programs/Interventions/Services • Four-, five-, and six-year graduation rates • National Survey of Student Engagement (NSSE) Data
What are we going to DO about it?Three-Year Plan: Big Ideas • First Year Critical – DFW – Improvement Strategies • Predictive analysis and interventions • Institutional Commitments: • First-year programs • Support: Orientations, Tutoring Centers, RPG Guides, etc. • Degree Works (Wolf Watch) • Center for Teaching & Learning • Increase student load per semester • Engaging male students • Declaring majors by 60 hours; then Departmental ownership • Study Institutional Policies and Procedures affecting time to degree Note: The details of the plan will be an evolving one, based on faculty input and emerging creative ideas. Student, Faculty, Administrative Culture
Thank you for this opportunity to look more carefully at ourselves! What are we missing?