Download

1 / 32
320 likes | 401 Views
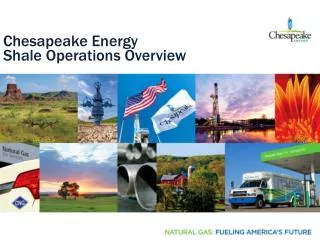
Chesapeake Energy Corporation. By: Edward Kennedy Matt Byford Presented, April 14 th 2009. Presentation. Business Operation/Mission Legislative/Industry Outlook Comparables Valuation Conclusion. Business │ Operations │ Outlook │ Valuation & Comparables | Conclusion. Business.

E N D
Chesapeake Energy Corporation • By: • Edward Kennedy • Matt Byford Presented, April 14th 2009
Presentation • Business • Operation/Mission • Legislative/Industry Outlook • Comparables • Valuation • Conclusion Business │ Operations │ Outlook│Valuation & Comparables | Conclusion
Business • Largest independent producer of natural gas in the United States • As of December 31, 2008, we had 12.051 trillion cubic feet equivalent of proved reserves, of which 94% were natural gas and all of which were onshore in the U.S. • During 2008, we produced an average of 2.303 bcfe per day, an 18% increase over the 1.957 bcfe per day produced in 2007. (billion cubic feet equivalent) • During the second half of 2008, we entered into joint venture arrangements that monetized a portion of our investment in three of the Big 4 Shale plays and provide drilling cost carries for our retained interest. Business │ Operations │ Outlook│Valuation & Comparables | Conclusion
Business Strategy • Create value for investors by building one of the largest onshore natural gas resource bases in the United States • Grow through the drillbit • Control Substantial Land and Drilling Location Inventories • Develop Proprietary Technological Advances • Build Regular Scale • Focus on Low Costs • Mitigate Natural Gas and Oil Price Risk • Form Unique Joint Venture Arrangements Business │ Operations │ Outlook│Valuation & Comparables | Conclusion
Mitigate Price Risk • Chesapeake Energy have been able to deliver attractive profit margins and financial returns through all phases of the commodity price cycle. • proactively hedging the prices we receive for a majority of our natural gas and oil production • We believe this price volatility is likely to continue in the years ahead • As of February 17, 2009, we have natural gas and oil swaps and collars in place covering 78% and 48% of our expected production in 2009 and 2010 Business │ Operations │ Outlook│Valuation & Comparables | Conclusion
Low Cost Controls • Chesapeake Energy believe their low cost structure is the result of: • Management’s effective cost-control programs • A high-quality asset base • Extensive and competitive services and natural gas processing and transportation infrastructures that exist in our key operating areas. • significant investments in our drilling rig and trucking service operations and in our midstream gathering and compression operations. Business │ Operations │ Outlook│Valuation & Comparables | Conclusion
Joint Venture Agreements • In the second half of 2008, the company entered into three joint venture arrangements covering three of the company’s Big 4 shale plays • In the joint ventures, the company has collaborated with other leading energy companies to accelerate the development of the company’s properties • Sold leasehold and producing property assets which had a cost basis of approximately $1.2 billion to these three joint venture partners for total cash consideration of $4.0 billion and up to $4.6 billion of future drilling cost carries while retaining a majority interest in each joint venture. Business │ Operations │ Outlook│Valuation & Comparables | Conclusion
Diverse Shale Production • “Big Four” Shale Plays • Barnett Shale = Forth Worth Basin of north-central Texas • Haynesville Shale = Ark-La-Tex area of northwestern Louisiana and East Texas • Fayetteville Shale = Arkoma Basin of central Arkansas • Marcellus Shale = northern Appalachian Basin of West Virginia, Pennsylvania and New York • Substantial Secondary Plays • Mid-Continental Basin • Appalachian Basin • Permian Basin • Delaware Region • Texas Gulf Coast Region Business │ Operations│ Outlook│Valuation & Comparables | Conclusion
Diverse Shale Production Business │ Operations │ Outlook│Valuation & Comparables | Conclusion
Operations • Shale gas is the fastest growing energy sector in the United States. • In late 1990’s, the application of horizontal drilling enabled more aggressive development • Although the basic technology of shale gas production has now been proven, the differences in rock mineralogy and geology that occur when moving over such large distances means that each new area still requires that the approach be refined, and proven of delivering commercial rates of production. (barriers to entry) Business │ Operations│ Outlook│Valuation & Comparables | Conclusion
Operations • Production of gas from the shales is not new, although development on a large scale is relatively recent, the best known example of which is the Barnett shale in the Fort Worth Basin of Texas. • Gas is held in the shale not only in tiny pores, but also in a solid solution bound onto the rock grains. The key to producing these shales is connecting the pores through the introduction of an artificial fracture system, and lowering the pressure in the rock Business │ Operations│ Outlook│Valuation & Comparables | Conclusion
Natural Gas Performance Business │ Operations│ Outlook│Valuation & Comparables | Conclusion
Legislative Outlook • On September 22, 2008 Barack Obama proposed a bill in the Senate: • Democrat candidate and Illinois Senator, Barack Obama, still found time last week to introduce legislation (S.3506) that would increase the tax credit for individuals that purchase natural gas vehicles and extend the credit through to the end of 2017. The Obama administration may be a shot in the arm for Haynesville Shale producers. • http://online.wsj.com/video/can-obama-save-the-us-naturalgas-industry/7F633C4C-B9E1-417E-AC9C-D80711942D30.html Business │ Operations │Outlook│Valuation & Comparables | Conclusion
Industry Outlook • Domestic Alternative to Crude Oil • Clean and Affordable Alternative to Coal Production • Natural Gas plants cost 25% less than capital intensive coal plants • Tax Credits for individuals and cities that utilize natural gas vehicles (increased demand) • Compressed natural gas expected to grow annually 5.8% from 2007-2030, according to the Energy Info Administration • Utilities are accessing natural gas over coal for electricity (increased demand) Business │ Operations │Outlook│Valuation & Comparables | Conclusion
Company Issues • Level of Indebtedness could limit financial flexibility • We may incur additional debt, including secured indebtedness, or issue additional series of preferred stock in order to develop our properties and make future acquisitions. • Price declines in 2008 resulted in write-downs of their assets carrying value and further price declines could result in additional write-downs in the future • Financial statements as of and for the year ended December 31, 2008 reflect an impairment of approximately $1.7 billion, net of income tax, of our natural gas and oil properties. Business │ Operations │Outlook│Valuation & Comparables | Conclusion
Company Issues • Significant capital expenditures are required to replace reserves • Our exploration, development and acquisition activities require substantial capital expenditures. Historically, we have funded our capital expenditures through a combination of cash flows from operations, our revolving bank credit facility and debt and equity. • Certain of our undeveloped leasehold acreage is subject to leases that will expire over the next several years unless production is established on units containing the acreage. • As of December 31, 2008, we had leases on approximately 0.46 million and 1.25 million net acres, respectively, in the Haynesville and Marcellus Shale areas. A sizeable portion of this acreage is not currently held by production. Unless production in paying quantities is established on units containing these leases during their terms, the leases will expire. Business │ Operations │Outlook│Valuation & Comparables | Conclusion
Executive Compensation • Base Salary • Cash Bonuses • Long-Term Incentives • Restricted Stock – four year vesting period • 401K Matching Contributions - match up to 15% • Perquisites • Monthly Country Club Dues • Personal Aircraft Use • Accounting Services
Executive Compensation (cont.) • Chesapeake Energy has not reported its Fiscal 2008 Definitive Proxy Statement • General and Administrative Expenses, which comprise stock-based compensation: • $377 million in 2008 • $243 million in 2007 • $139 million in 2006
Executive Compensation (cont.) • Stock-Based Compensation • $85 million for 2008 • $58 million for 2007 • Due to an increase in the number of unvested restricted shares outstanding in 2008 • Stock-Based Compensation represented $.10 per mcfe produced in 2008 and guidance is between $.10 - $.12 for 2009
Credit Outlook • Moody’s • Jan. 28, 2009: assigns Ba3 to Chesapeake Energy senior unsecured notes; stable outlook • Standard and Poor’s • Jan. 28, 2009: assigns BB to Chesapeake Energy senior unsecured notes; stable outlook Business │ Operations │Outlook│Valuation & Comparables | Conclusion
Debt Outlook • February 2009: • Issuance of $1.425 billion of 9.5% Senior Notes due 2015 • Total Indebtedness sums to $14.184 billion • A majority of these obligations are not maturing within the upcoming 5 years • Indebtedness represents 43% of our total book capitalization Business │ Operations │Outlook│Valuation & Comparables | Conclusion
Debt Outlook Business │ Operations │Outlook│Valuation & Comparables | Conclusion
Lease Outlook • As of December 31, 2008, minimum future lease payments were as follows ($ in millions): • RigsCompressorsOtherTotal • 2009 $94 $40 $8 $142 • 2010 95 34 5 134 • 2011 95 34 3 132 • 2012 96 36 2 134 • 2013 97 39 1 137 • After 143125268 • Total $620$308$19$947 Business │ Operations │Outlook│Valuation & Comparables | Conclusion
Reserve Outlook • Proved developed producing reserves (PDPs) are obviously the most objective, whereas proved undeveloped reserves (PUDs) have the most to prove Business │ Operations │Outlook│Valuation & Comparables | Conclusion
Shareholder Overview Business │ Operations │ Outlook│Valuation & Comparables | Conclusion
Equity Repurchases/Dividends • October 2008 • Repurchased 24,174 shares at $22.388 • November 2008 • Repurchased 15,976 shares at $20.658 • December 2008 • Repurchased 5,285 shares at $15.829 • Repurchases used to pay tax burden on restricted stock grants (43,000 shares repurchased) • Increased dividend payout in 2008 to $.075/share each quarter from $.0675/share over the previous year. Business │ Operations │ Outlook│Valuation & Comparables | Conclusion
Correlation Structure Business │ Operations │ Outlook│Valuation & Comparables | Conclusion
Comparable Companies • Anadarko Petroleum Corp. (APC) • engages in the exploration and production of oil and gas properties primarily in the United States, the deepwater of the Gulf of Mexico, and Algeria. • Questar Corp. (STR) • engages in oil and gas exploration and production, midstream field services, energy marketing, interstate gas transportation, and retail gas distribution. • Southwestern Energy Corp. (SWN) • engages in the exploration, development, and production of natural gas and crude oil in the United States. Business │ Operations │ Outlook│Valuation & Comparables | Conclusion
Comparable Companies Business │ Operations │ Outlook│Valuation & Comparables | Conclusion
Stock Performance Business │ Operations │ Outlook│Valuation & Comparables | Conclusion
Valuations • Comparables = Fairly Valued • CAPM WACC = 9.27% • ROE WACC = 9.1% • Goal-Post Theory Valuation = $30.42 • Range: 27.38 - 33.46 Business │ Operations │ Outlook│Valuation & Comparables | Conclusion
Conclusion • We would like to recommend the purchase of 200 shares of Chesapeake Energy • Current Stock Price: $20.74 • HOWEVER, due to the imminent filing of the 10-k and proxy, we would like to review those for any irregularities, particularly items of executive compensation before establishing any position. Business │ Operations │ Outlook│Valuation & Comparables | Conclusion