Download
1 / 23
230 likes | 233 Views
This article highlights the key trends in the national suckler herd, including genetic evaluation systems, data schemes, and government-supported breeding programs. It discusses the value of genetic gain, the impact of the Beef Data and Genomics Program, and the importance of reducing GHG emissions. The article also touches on trends in carcass weights, age at slaughter, and carcass conformation.

E N D
Key Trends from National Suckler Herd. Dail Agricultural Affairs Committee. 22 May 2018
1m AI recs/yr Genetic Evaluation System Teagasc Research AI Companies Knowledge 30m animals with 100m+ records. Insems & Genetic Evaluations 660k MR recs/yr Data Schemes, e.g., BVD, BDGP, Origin Green Milk Recording ICBF Database Milk Production & Management Rpts Data for services 2.3 m birth recs/yr Herd Books Ped. Certs & Linears 100k farmers are now serviced from the database. Dairy & Beef Farmers Animal Events DAFF - AIM Calf reg & movements 2.3m BVD recs/yr 1.6 m carcass recs/yr Health & disease data Carcass data Slaughter Factories Vets & vet labs. Weight & price Genotypes Marts & auctioneers Reports Bulk Tank Genotypes & gen labs. 2 Milk Co-ops 7.0 m movement records/yr 500k genotype recs/yr Teagasc & ACA Advisors
€uro-Star Replacement Index. • The ideal Irish beef cow; A weaned calf every year of good weight & quality. 3
Range of breeds on Top Bull Listing => Focused on promoting these bulls within the relevant breeds. 4
Beef Data & Genomics ProgramOn-Farm Validation Study. 5 • Large scale beef genomics project in Ireland. 1.3m beef animals genotyped to date. 24k farmers and 600k cows involved. Funded as part of RDP. Goal to breed more profitable and carbon efficient beef cows. • Initial results based on Teagasc-ICBF validation study indicate that 5 star cows are €136 more profitable per parity and produce 550 kg less CO2e in their lifetime (Gross Emissions Output)
Growth rate of weanlings per milk score (Twomey, 2018). • h2 of cow milk score =34% (Note: milk yield in dairy cows is ~35%). • h2 of maternal weaning weight = 4%. • rg of 0.7 with maternal weaning weight 6
€1000+ Weanlings; % by Stars • Of the 11,180 €1000+ weanlings sold across marts in 2017, 37% were from 5 star suckler beef cows. This is compared to only 13% being from 1 star cows. * Based on 11,180 €1000+ weanlings sold across 66 marts in 2017. 7
Value of Genetic Gain for Terminal Index • Steady increase in terminal index. • No increase in replacement index until more recent years => beef genomics • As an industry have been too heavily focus on carcass traits. Gain in Terminal index has been worth €70 per animal slaughtered or €580m to Irish beef farmers. 8
The Value of ICBF & Govt/Industry Supported Programs – Terminal Index. Suckler cow scheme to promote sire recording. ICBF, the database & Govt projects has contributed 60-70% of the €580m & growing. ICBF database & Animal Events. Worth €160m Worth €130m 9
The Value of Govt/Industry supported Programs – Rep Index. Beef genomics scheme to promote replacement index Worth €80m to date & €600m by 2030 10
Genetic Trends in Replacement Index for ¾ bred and 1st cross beef cows. • 77% of replacement females are ¾ bred. Up from 74% in 2008. • Due to BDGP, rate of genetic gain for replacement index is higher for ¾ bred beef females than 1st cross animals from dairy herd. 11
Impact of BDGP => Gains in productivity. • Clear gain in productivity for all key metrics within BDGP herds. For example, calves/cow/year has increased from 0.80 to 0.87. • Comparable figure for all suckler herds, calves/cow/year has increased from 0.79 to 0.85. 12
Average Carcase Weights Decline -4.5kg -3.5kg -1.8kg -2.2kg Slight decline in average carcase weights: due primarily to a higher % of animals coming from the dairy herd, but also earlier finishing. 13
Why the Average Carcase Weights Decline – Steers? Average carcass weights are increasing across suckler beef, dairy beef and dairy steers. But, % of dairy beef steers has increased significantly resulting in overall reduction in carcass weight of steers. 14
Impact on age at slaughter – Steers. Again age at slaughter is decreasing across suckler beef, dairy beef and dairy steers. Now 27.5 months. Down 11 days from 2016. But, % of dairy beef steers has increased significantly resulting in greater overall reduction in average age at slaughter. 15
Impact on carcass conformation – Steers. Average carcass conformation of suckler bred steers has stayed constant (R=). Conformation of dairy beef and dairy bred steers has declined slightly. Combined with overall increase in % dairy beef steers, resulted in slight decrease in average carcass conformation. 16
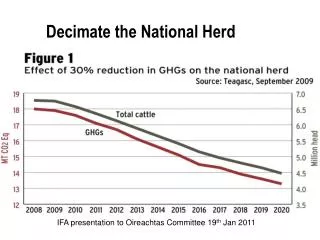
Why are GHG emissions important? Potential to produce more sustainably. Environmental and financial benefits. Sources: Teagasc & Bord Bia Dairy Beef Systems are more climate efficient than suckler beef. Opportunity to carry increased numbers of productive animals. 17
Usage of non-pedigree beef bulls. • Usage of non-pedigree beef bulls has declined. Now under 10%. • Positive impact of BDGP and also ICBF G€N€ IR€LAND Breeding Program strategy of focusing on within breed improvement. 18
Trends in Pedigree Beef Bull Registrations. • Steady increase in use of pedigree beef bulls. For example of the 17,012 pedigree beef bulls registered in 2015, 12,652 were sold/moved to another herd, of which 4,244 were to dairy herds. 19
Changes in Stars (May 2015 => Aug 2017) • 75% females still 4&5 stars. Ancestry data good for high heritability traits. • Benefits of genomics especially relevant for lower heritability traits, e.g., fertility, milk, health, disease, GHG etc… 20
Trends in Suckler cow numbers. • Total suckler cow numbers for 30 June 2017 were 1,007,809. Down from 1,018,209 in 2016 (- 1.1%). • Reductions more pronounced in West Ireland. • Suckler cow slaughtering’s increased significantly in 2017 (159,847 – up 8%). • Reflected in suckler cow calving figures for year to date. Currently at 487k (up to May 1), down 6% for year to date. • Suggest further reduction in size of suckler herd in 2018 (expect drop of 4-5%). 21
Average farm income. 22 Lack of family farm income a major factor for beef cattle sector. Beef cows are an important part of rural infra-structure. Teagasc Presentation Footer
Our Farmer & Government Representation Our AI & Milk Recording Organisations Our Herdbooks Acknowledging Our Members 23