Download
1 / 14
140 likes | 306 Views
CAPE-B: Critical Power Analysis Code for BWR Fuel Bundle - Evaluation Method -. Calculation Method. Analytical Step. 3-D Subchannel Analysis with Drift-flux Model. 1. Fuel Bundle. 3-D Liquid Droplet Transport Analysis In Turbulent Steam Flow. 2. Spacer Effect. Liquid Film Flow Analysis.

E N D
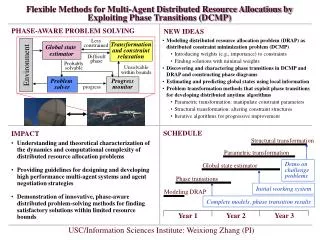
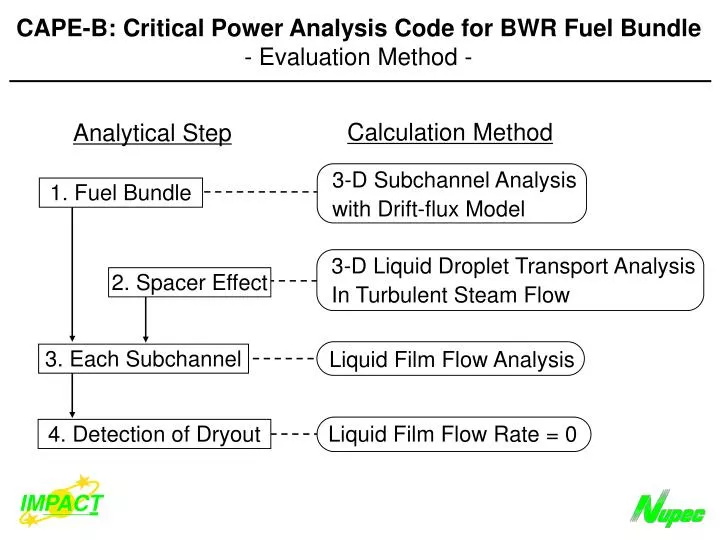
CAPE-B: Critical Power Analysis Code for BWR Fuel Bundle - Evaluation Method - Calculation Method Analytical Step 3-D Subchannel Analysis with Drift-flux Model 1. Fuel Bundle 3-D Liquid Droplet Transport Analysis In Turbulent Steam Flow 2. Spacer Effect Liquid Film Flow Analysis 3. Each Subchannel 4. Detection of Dryout Liquid Film Flow Rate = 0 IMPACT
CAPE-B: Verification of Subchannel Analysis Model (1. Analysis of the test conducted by Lahey, et al.) :Corner :Corner Pressure : 6.9 Mpa Number of axial subchannel division : 50 Heated test (13 test runs) Average mass flux : 719-1464 kg/m2s Inlet subcooling : 68-603 kJ/kg Heated length : 1.83 m Power distribution : Uniform Heat flux : 710-2130 W/m2 :Side :Side :Inner :Inner Un-heated test (4 test runs) Average mass flux : 651-2671 kg/m2s Inlet subcooling : 1174 kJ/kg 4000 0.5 +s (Measurement error) e=0.024 (Standard deviation) s=7% +e -e -s 0.4 3000 0.3 Calculated quality Calculated mass flux (kg/m2s) 2000 0.2 1000 0.1 0 0 2000 3000 4000 1000 0.1 0.2 0.3 0.4 0.5 IMPACT Measured mass flux (kg/m2s) Measured quality (b) Comparison of steam quality (a) Comparison of mass flux
CAPE-B: Verification of Subchannel Analysis Model (2. Analysis of NUPEC full scale bundle test) : Present calculation 0.8 : COBRA-BWR Radial power distribution : 1.30 : 1.15 : 0.90 : 0.45 Test data 0.6 Regional average void fraction 0.4 Pressure : 7.2 Mpa Mass flow rate : 1562 kg/m2s Inlet subcooling : 50.2 kJ/kg Axial power distribution : Uniform Number of axial subchannel division : 48 0.2 IN-2 PERI IN-1 IN-3 IMPACT IN-2 IN-3 PERI IN-1 Region in bundle
CAPE-B: Concept of Liquid Film Flow Analysis Fuel rod Dryout Liquid film Heat transfer to liquid film Outflow from the mesh (=Inflow to the next mesh) Entrainment rate: E d G ( ) f G + d z f d z Evaporation rate: B d G p f e dz = ( D - E - B ) d z A Deposition rate: D Mesh height Liquid droplet IMPACT Inflow to the mesh: Gf
CAPE-B: Verification of Spacer Effect Analysis Model (Analysis of the test conducted by Nagayoshi, et al.) 30 mm Hot wire probe 10 mm Plate spacer (Thickness: 0.5, 1.0 mm) 40 mm Flow Rectangular duct Rectangular duct (a) Test section 70 meshes 50 mm 30 mm 80 mm Z Flow 42 meshes 10 mm Z=0 IMPACT Plate spacer (Thickness: 0.5, 1.0 mm) (b) 2-dimensional analysis region
CAPE-B: Turbulent Enhancewment due to the Spacer (Analysis of the test conducted by Nagayoshi, et al.) 4 Thickness Exp. Cal. ∞ u'/u' 0.5 mm 1.0 mm 3 2 Increment ratio of turbulent fluctuation 1 IMPACT 0 10 20 30 40 50 Distance from the edge of the spacer (mm)
CAPE-B: Test analysis condition for model validation EPRI 44 NUPEC 88 Bundle Type Bundle No. 301 Grid Spacer, no W/R Bundle No. C2A Ferrule Spacer, 1 W/R Bundle No. III Grid Spacer, 2 W/Rs Pressure (Mpa) 5.5, 7.2, 8.6 7.2, 8.6 4.1, 6.9, 8.6 Mass flux (kg/m2s) 590-1,910 570-1,690 700-1,750 Inlet subcooling (kJ/kg) 20-130 10-125 50-610 Heated length (m) 3.7 3.7 1.8 Power Axial 24-step chopped cosine with p/f of 1.4 Uniform Distribution Radial Local p/f: 1.30 Local p/f: 1.18 Local p/f: 1.02 Number of data points 70 72 38 Subchannel Axial 72 72 72 Division Radial 80 81 25 Spacer effect Coordinates Cylindrical Cartesian Cartesian Analysis Mesh division 206488 404090 404090 IMPACT W/R: Water Rod, p/f: peaking factor
CAPE-B: Two Typical Spacer Types 1/4 Subchannel 1/4 Subchannel Fuel rod Fuel rod Grid type spacer Ferrule type spacer IMPACT
CAPE-B: Validation analysis for BWR models (Analyses of the NUPEC 88 and EPRI 44 tests) 12 + Average difference : 0.5% - =5.1% (Standard deviation) 10 8 6 Calculated critical power (MW) 4 2 Pressure : 6.9 - 7.2 MPa Number of data points : 116 0 2 4 6 8 10 12 IMPACT Measured critical power (MW) (a) Comparison at rated pressure
CAPE-B: Validation analysis for BWR models (Analyses of the NUPEC 88 and EPRI 44 tests) 12 Average difference : - 0.3% + - =6.3% (Standard deviation) 10 8 Pressure (MPa) : 8.6 6 : 6.9 - 7.2 Calculated critical power (MW) : 5.5 : 4.1 4 2 Number of data points : 166 0 2 4 6 8 10 12 IMPACT Measured critical power (MW) (b) Comparison with all data
CAPE-B: Comparison of dryout locations Dryout locations 0.98 0.98 0.98 1.18 1.10 1.10 1.15 1.15 Bundle Cal. Test 0.99 III and C2B 0.60 1.15 1.18 1.10 0.60 0.98 1.15 1.15 C2A 1.18 0.75 0.98 0.98 0.98 0.98 0.60 1.10 1.30 0.45 0.99 0.99 0.99 WR 0.98 0.98 0.98 1.10 1.15 0.89 0.89 Bundle III 1.18 1.18 0.99 0.60 0.98 1.10 1.10 1.30 0.89 0.89 WR 1.18 0.99 0.99 0.98 0.98 0.98 0.89 1.30 0.89 WR : Water rod 0.99 0.75 0.99 0.99 0.99 0.99 0.60 0.98 1.15 0.45 0.89 0.89 0.89 0.89 1.18 0.99 0.75 0.99 0.99 0.75 0.99 0.98 1.30 1.15 0.45 0.89 0.89 0.45 1.15 0.99 1.18 0.99 0.99 0.99 0.99 0.99 0.99 1.15 1.15 1.15 1.15 1.15 1.30 1.15 1.30 IMPACT Bundle C2A, C2B
CAPE-B: Effect of radial power peaking Pressure : 7.2 MPa 10 Inlet subcooling : 50.2 kJ/kg Radial power peaking factor : 1.18 9 8 Critical power (MW) Radial power peaking factor : 1.30 7 6 Spacer Exp. Cal. Bundle No. C2B Ferrule type 5 ~ C2A ~ ~ ~ 0 IMPACT 2000 500 1000 1500 Mass flux (kg/m2s)
CAPE-B: Critical power difference by spacer type 10 Pressure : 7.2 MPa Inlet subcooling : 50 kJ/kg 9 8 Critical power (MW) 7 6 Bundle No. Spacer Exp. Cal. ~ ~ ~ ~ Ferrule C2B 5 III Grid 500 1000 1500 2000 IMPACT Mass flux (kg/m2s)
CAPE-B: Droplet deposition characteristics Spacer Location : Ferrule 0.3 : Grid Ferrule Spacer Droplet transport rate (m/s) 0.2 0.1 Grid Spacer 0 50 100 150 200 250 IMPACT Axial distance (mm)