Download
1 / 23
230 likes | 308 Views
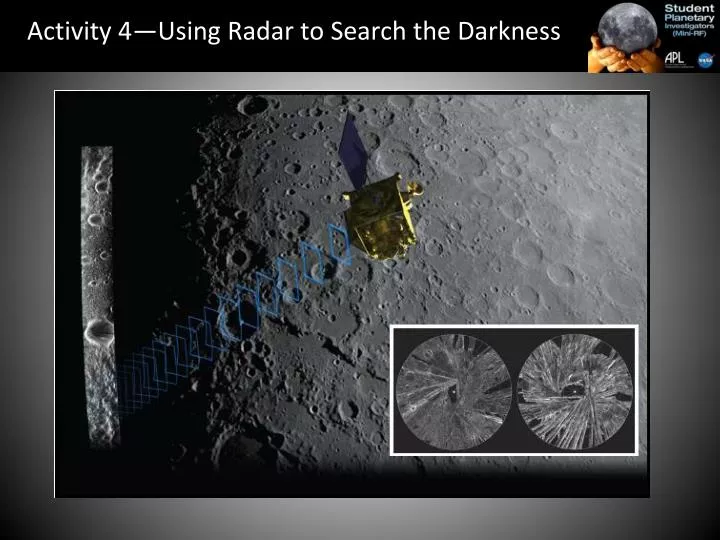
Activity 4—Using Radar to Search the Darkness. Searching for clues…. Mini-RF part 1 Mini-RF part 2. More than water?. Mini-RF also looks at surface and subsurface of the moon far side surface properties and composition of the moon. Part 1: Image Analysis.

E N D
Searching for clues… Mini-RF part 1 Mini-RF part 2
More than water? • Mini-RF also looks at • surface and subsurface of the moon • far side • surface properties and composition of the moon
Part 1: Image Analysis • On the left is a photograph taken by Space Shuttle astronauts as the Shuttle Endeavor passed over the eruption of Kliuchevskoi volcano in Kamchatka, Russia. • On the right is the radar image acquired by the SIR-C/X-SAR radar instrument.
Look at both images of the volcano. What are three features you can see in the radar image, that are hidden in the visible image?
How does radar “see”? • Visible light = small wavelength • Bounces off every object including smoke and water • By the time it is transmitted through the smoke or rain, it has been scattered too much. • Radar = longer wavelength • doesn’t reflect or bounce around the water droplets or smoke particles as much and therefore, can enter and exit the clouds relatively undistorted
Visible light • range of wavelengths • radar • measure one very specific wavelength. • Just think of how differently things would look if you could only see yellow. • Your eyes would only detect how brightly an object scattered yellow, so the reflection's intensity, not the color, is what would give you new and useful information.
Part 2: Unmasking the surface • These views are part of the Nile River, near the Fourth Cataract in Sudan. • The thick, white band in the top right of the radar image is an ancient channel of the Nile that is now buried under layers of sand.
Unmasking the surface, cont. • radar can penetrate below the surface of the sand to a certain depth • scientists can see where the river used to be and where it is today.
How can we use what we learn from the image to help establish agricultural areas along the Nile? • Using the radar images, how could scientists track future changes to the path of the Nile? • List ways that radar images from space can give us information needed to help manage and solve issues such as environmental issues on the Earth and possible landing sites on the Moon.
Mini RF and Polarization—how it works • Typical planetary surfaces reverse the polarization during the reflection of radio waves, so that normal echoes from Mini-RF are right circular polarized • If the signal comes back to the instrument reversed, it is said to have “opposite sense” or, OC • If it comes back the same polarization, its said to have the “same sense” or SC
Circular Polarization Ratio (CPR) • If there is more “opposite sense--OC” than “same sense--SC” of a polarized signal reflected back to the spacecraft, then the surface is said to have a “Low CPR” or low Circular Polarization Ratio. • In science terms, this means a surface is smooth. Here is the ratio: CPR = SC/OC
Comparing data—water? • Scientists can then compare this to data sets such as the LROC (Lunar Reconnaissance Orbiter Camera) images or Clementine images. • Scientists can then look at the Mini-RF data showing a high ratio and compare this with visible images of the Moon. • If the high ratio images look visually smooth, then something else must be present: water ice!
Part 4: CPR Image Analysis • Take a look at the color radar image below. This is an image that was taken of a volcano in northern Arizona. Compare the visible image on the left with the radar image on the right. • What differences do you notice between the two images below? • (Note: High CPR, (circular polarization ratio)=rough)
Next, take a look at the color bar. • What is the one thing you can determine about the brightly colored area in the radar image?
Could you tell in the visible image if the dark region is smooth or rough? Why or why not?
Image interpretation • The image shows a visible image on the right, and a false colored radar image to the left. • It is difficult to tell in the visible image if the dark area is rough or smooth. But using radar, we can see using the colored CPR bar at the bottom, that the surface is fairly rough. • We can also confirm this in the close up image of the same region in the lower right.
Part 5: Comparing visible and radar imagesOrientale Basin • Materials • Vis-à-vis markers, • “Context for Orientale Basin” image, • “Orientale Basin image with Mini-RF data” image, • Clear overhead transparency • Lunar Landforms and Associated Images sheets (found in your binder)
Background • Dark areas on the surface of the Moon can indicate different things. Not only does Radar help us peer into permanently shadowed areas on the moon, it also helps us analyze other features • By analyzing the MiniRF image and, overlaying that on a visible image of the moon, scientists can gain a better understanding of what is happening on the surface of the moon that visible images may not reveal.
The color enhancement allows scientists to see the different features with more clarity than just simply looking at a black and white image. • The blues are low CPR and reds are high. High CPR suggests a ‘rough’ surface, at the wavelength of the radar signal.
Procedure • Now, lets do some analysis: taking note of the color, list 3 surface features you can see with the Mini-RF overlay image, that you cant see in the black and white Clementine image: • Next, place a clean overhead transparency over the image “Orientale Basin with Mini-RF Data”. Tape the corners with clear tape so the transparency doesn’t move. • Using the “Vis-à-vis” markers, make notes on the image that show geologic features (lava tubes, craters, maria, lava flows, etc. Also note areas of high CPR, and low CPR, and what that could indicate). • This allows us to determine the geologic history of the area
Orientale Basin Geologic History • It is over 3 billion years old, about 965 kilometers (600 miles) across and was formed by the impact of an asteroid sized object. • The collision caused ripples in the lunar crust resulting in the three concentric circular features • Molten lava from the Moon's interior flooded the impact site through the fractured crust creating a mare. • Dark, smooth regions on the moon are called mare
Additional Activities • Using the visible image of the South pole of the moon, identify areas or regions that appear to have permanently shadowed areas. • Using the Mini-RF images, try to identify the corresponding areas. • Once you have identified where the image strips are located, you must then assemble all of the images on top of the visible image you have of that particular location. • Once that is complete, you must then begin to identify regions on the surface that have signatures that are different than the surrounding areas.