Download
1 / 45
460 likes | 606 Views
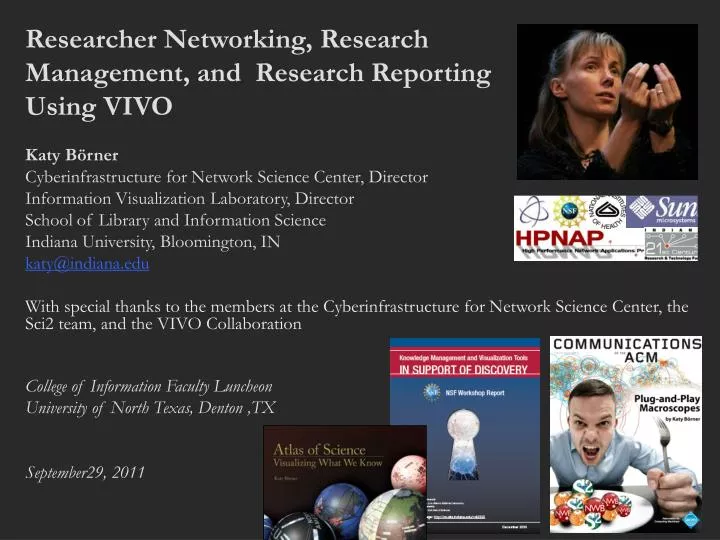
Researcher Networking, Research Management, and Research Reporting Using VIVO Katy Börner Cyberinfrastructure for Network Science Center, Director Information Visualization Laboratory, Director School of Library and Information Science Indiana University, Bloomington, IN

E N D
Researcher Networking, Research Management, and Research Reporting Using VIVO Katy Börner Cyberinfrastructure for Network Science Center, Director Information Visualization Laboratory, Director School of Library and Information Science Indiana University, Bloomington, IN katy@indiana.edu With special thanks to the members at the Cyberinfrastructure for Network Science Center, the Sci2 team, and the VIVO Collaboration College of Information Faculty Luncheon University of North Texas, Denton ,TX September29, 2011
Börner: Insightful Visualizations of National Researcher Networking Data Different Stakeholder Groups and Their Needs Funding Agencies • Need to monitor (long-term) money flow and research developments, identify areas for future development, stimulate new research areas, evaluate funding strategies for different programs, decide on project durations, funding patterns. Scholars • Want easy access to research results, relevant funding programs and their success rates, potential collaborators, competitors, related projects/publications (research push). Industry • Is interested in fast and easy access to major results, experts, etc. Influences the direction of research by entering information on needed technologies (industry-pull). Advantages for Publishers • Need easy to use interfaces to massive amounts of interlinked data. Need to communicate data provenance, quality, and context. Society • Needs easy access to scientific knowledge and expertise.
Börner: Insightful Visualizations of National Researcher Networking Data Scholars Have Different Roles/Needs Researchers and Authors—need to select promising research topics, students, collaborators, and publication venues to increase their reputation. They benefit from a global view of competencies, reputation and connectivity of scholars; hot and cold research topics and bursts of activity, and funding available per research area. Editors—have to determine editorial board members, assign papers to reviewers, and ultimately accept or reject papers. Editors need to know the position of their journals in the evolving world of science. They need to advertise their journals appropriately and attract high-quality submissions, which will in turn increase the journal’s reputation and lead to higher quality submissions. Reviewers—read, critique, and suggest changes to help improve the quality of papers and funding proposals. They need to identify related works that should be cited or complementary skills that authors might consider when selecting project collaborators. Teachers—teach classes, train doctoral students, and supervise postdoctoral researchers. They need to identify key works, experts, and examples relevant to a topic area and teach them in the context of global science. Inventors—create intellectual property and obtain patents, thus needing to navigate and make sense of research spaces as well as intellectual property spaces. Investigators—scholars acquire funding to support students, hire staff, purchase equipment, or attend conferences. Here, research interests and proposals have to be matched with existing federal and commercial funding opportunities, possible industry collaborators and sponsors. Team Leads and Science Administrators—many scholars direct multiple research projects simultaneously. Some have full-time staff, research scientists, and technicians in their laboratories and centers. Leaders need to evaluate performance and provide references for current or previous members; report the progress of different projects to funding agencies.
Börner: Insightful Visualizations of National Researcher Networking Data Why Use National Researcher Networking Data? • Structured data – Easy to process by computers. • Comprehensive – Not only publication but also funding, teaching, patenting activity is captured. • High quality – faculty record, funding, course data has “touched” money. • Linked to other data silos via Linked Open Data. • (Inter)National – Science is a global enterprise and needs to be studied/understood globally. • Open – Anybody can access detailed data, re-run analysis. Many NRN instances hold and expose Thomson Reuters, Elsevier, MEDLINE, NSF, NIH and other data.
VIVO and VIVO Visualizations 5
VIVO: A Semantic Approach to Creating a National Network of Researchers (http://vivoweb.org) • Semantic web application and ontology editor originally developed at Cornell U. • Integrates research and scholarship info from systems of record across institution(s). • Facilitates research discovery and cross-disciplinary collaboration. • Simplify reporting tasks, e.g., generate biosketch, department report. Funded by $12 million NIH award. Cornell University: Dean Krafft (Cornell PI), Manolo Bevia, Jim Blake, Nick Cappadona, Brian Caruso, Jon Corson-Rikert, Elly Cramer, Medha Devare, John Fereira, Brian Lowe, Stella Mitchell, Holly Mistlebauer, Anup Sawant, Christopher Westling, Rebecca Younes. University of Florida: Mike Conlon (VIVO and UF PI), Cecilia Botero, Kerry Britt, Erin Brooks, Amy Buhler, Ellie Bushhousen, Chris Case, Valrie Davis, Nita Ferree, Chris Haines, Rae Jesano, Margeaux Johnson, Sara Kreinest, Yang Li, Paula Markes, Sara Russell Gonzalez, Alexander Rockwell, Nancy Schaefer, Michele R. Tennant, George Hack, Chris Barnes, Narayan Raum, Brenda Stevens, Alicia Turner, Stephen Williams. Indiana University: Katy Borner (IU PI), William Barnett,Shanshan Chen, Ying Ding, Russell Duhon, Jon Dunn, Micah Linnemeier, Nianli Ma, Robert McDonald, Barbara Ann O'Leary,Mark Price, Yuyin Sun, Alan Walsh, Brian Wheeler, Angela Zoss.Ponce School of Medicine: Richard Noel (Ponce PI), Ricardo Espada, Damaris Torres.The Scripps Research Institute: Gerald Joyce (Scripps PI), Greg Dunlap, Catherine Dunn, Brant Kelley, Paula King,Angela Murrell, Barbara Noble, Cary Thomas, Michaeleen Trimarchi.Washington University, St. Louis: Rakesh Nagarajan (WUSTL PI), Kristi L. Holmes, Sunita B. Koul, Leslie D. McIntosh.Weill Cornell Medical College: Curtis Cole (Weill PI), Paul Albert, Victor Brodsky, Adam Cheriff, Oscar Cruz, Dan Dickinson, Chris Huang, Itay Klaz, Peter Michelini, Grace Migliorisi, John Ruffing, Jason Specland, Tru Tran, Jesse Turner, Vinay Varughese.
Börner: Insightful Visualizations of National Researcher Networking Data Type of Analysis vs. Level of Analysis
Temporal Analysis (When) Temporal visualizations of the number of papers/funding award at the institution, school, department, and people level 10
Topical Analysis (What) Science map overlays will show where a person, department, or university publishes most in the world of science. (in work) 11
Network Analysis (With Whom?) Who is co-authoring, co-investigating, co-inventing with whom? What teams are most productive in what projects? 12
http://nrn.cns.iu.edu Geospatial Analysis (Where) Where is what science performed by whom? Science is global and needs to be studied globally.
Börner: Insightful Visualizations of National Researcher Networking Data Overview, Interactivity, Details on Demand come to commonly used devices and environments VIVO NRN on the Go
Börner: Insightful Visualizations of National Researcher Networking Data Develop VIVO VisualizationsSee also Visualization in VIVO Workshop on Aug 24, 2011http://wiki.cns.iu.edu/display/PRES/VIVO+Presentation
Börner: Insightful Visualizations of National Researcher Networking Data Develop VIVO Visualizationshttp://vivo-vis.slis.indiana.edu/vivo1/vis/word-cloud/n868
Custom VIVO Visualizations 17
Download Data • General Statistics • 36 publication(s) from 2001 to 2010 • (.CSV File) • 80 co-author(s) from 2001 to 2010 • (.CSV File) • Co-Author Network • (GraphML File) • Save as Image (.PNG file) • Tables • Publications per year (.CSV File) • Co-authors (.CSV File) • http://vivo.iu.edu/vis/author-network/person25557 18
v 36 publication(s) from 2001 to 2010 (.CSV File) 80 co-author(s) from 2001 to 2010 (.CSV File) Co-author network (GraphML File) Save as Image (.PNG file) Publications per year (.CSV File), see top file. Co-authors (.CSV File) 19
Run Sci2 Tool and Load Co-Author Network (GraphML File) Visualize the file using Radial Graph layout. Click on node to focus on it. Hover over a node to highlight its co-authors. Code and tutorials are linked from http://sci2.wiki.cns.edu Network Analysis Toolkit Nodes: 81 Edges: 390 20
Network Analysis Toolkit (NAT) was selected. Nodes: 109 Isolated nodes: 0 Node attributes present: label, number_of_authored_works, num_unknown_publication, num_latest_publication, latest_publication, profile_url, num_earliest_publication, earliest_publication, url Edges: 731 No self loops were discovered. No parallel edges were discovered. Average degree: 13.4128 This graph is weakly connected. There are 1 weakly connected components. (0 isolates) The largest connected component consists of 109 nodes. Density (disregarding weights): 0.1242 .......... Node Degree was selected. 21
Börner, Katy. (March 2011). Plug-and-Play Macroscopes. Communications of the ACM, 54(3), 60-69. Video and paper are at http://www.scivee.tv/node/27704 22
While microscopes and telescopes are physical instruments, macroscopes resemble continuously changing bundles of software plug-ins. Sharing algorithm components, tools, or novel interfaces becomes as easy as sharing images on Flickr or videos on YouTube. Assembling custom tools is as quick as compiling your custom music collection. They provide a common standard for - the design of modular, compatiblealgorithm and tool plug-ins - that can be easily combined into scientific workflows, and - packaged as custom tools.Anyone can map. Anyone can replicate or advance workflows. Plug-and-Play Macroscopes
http://sci2.cns.iu.edu http://sci2.wiki.cns.iu.edu 24
OSGi/CIShell powered tool, see http://cishell.org http://sci2.cns.iu.edu | http://sci2.wiki.cns.iu.edu Börner, Katy, Huang, Weixia (Bonnie), Linnemeier, Micah, Duhon, Russell Jackson, Phillips, Patrick, Ma, Nianli, Zoss, Angela, Guo, Hanning & Price, Mark. (2009). Rete-Netzwerk-Red: Analyzing and Visualizing Scholarly Networks Using the Scholarly Database and the Network Workbench Tool. Proceedings of ISSI 2009: 12th International Conference on Scientometrics and Informetrics, Rio de Janeiro, Brazil, July 14-17 . Vol. 2, pp. 619-630. Sci2 Tool – “Open Code for S&T Assessment”to run replicable workflows Sci Maps GUESS Network Vis Horizontal Time Graphs
Sci2 Tool Geo Maps Circular Hierarchy
Network Extraction: Examples Author co-occurrence network Paper-author 2-mode network
Börner: Insightful Visualizations of National Researcher Networking Data Learn how to run custom VIVO data queries and visualize resultsSee also Visualization in VIVO Workshop on Aug 24, 2011http://wiki.cns.iu.edu/display/PRES/VIVO+Presentation
Custom NRN Visualizations 35
2008 collaboration patterns for medical institutions located close to Melbourne University Source: Web of Science co authorship information. Compiled by Simon Porter
Co-authorship network for the department of Information Systems Source: Melbourne Research Windows. Contact Simon Porter simon.porter@unimelb.edu.au
Search term Researcher Bimodal network of search terms and researchers extracted from research profile search results to show the University’s capability in Disaster Management to the Government Contact: simon.porter@unimelb.edu.au
Top MeSH Disease Concepts Appearing in PubMed Publications by the University of Michigan Medical School.Links connect concepts where 100+ authors published about both concepts within the span of their careers. Contact: Jeffrey Horon, J.Horon@elsevier.com
Top MeSH Disease Concepts Appearing in PubMed Publications by the University of Michigan Medical School.Links connect concepts where 100+ authors published about both concepts within the span of their careers. This visualization revealed that animal disease models were central to disease research at U-M whiich encouraged additional thought and attention to animal husbandry, animal expenses, and core/shared services overall. Contact: Jeffrey Horon, J.Horon@elsevier.com
P30 Member Collaborations – Sponsored Project Co‐Participation and Co‐Authorship Network. Used in successful! P30 funding application. Shows the PI’s relationships with various P30 members, conveying that the PI was not only the formal center of the group but also the informal center and the person who exhibited the highest betweenness centrality. Contact: Jeffrey Horon, J.Horon@elsevier.com
Inter-Institutional Collaboration Explorer This visualization shows information about “collaborative publications” found at 2 or more Researcher Networking websites. The idea that institutions don't work together and that biomedical research is conducted in silos is not true. Researchers, even when separated by great distances, are in fact willing to work together, and this visualization demonstrates that they often do. Contact: Nick Benik (nbenik@gmail.com), Harvard Medical School, Boston, MA. URL: http://xcite.hackerceo.org/VIVOviz
Inter-Institutional Collaboration Explorer The outer solid colored arcs represent the 11 institutions. The size of the arc is proportional to the number of collaborative publications found on the site. The inner colored bands represent the number of collaborative publications found between the two institutions that each band connects. Clicking an institution's arc will hide any bands not connected to that institution and will display a timeline of when that institution's collaborative publications were written.
References Börner, Katy, Chen, Chaomei, and Boyack, Kevin. (2003). Visualizing Knowledge Domains. In Blaise Cronin (Ed.), ARIST, Medford, NJ: Information Today, Volume 37, Chapter 5, pp. 179-255. http://ivl.slis.indiana.edu/km/pub/2003-borner-arist.pdf Shiffrin, Richard M. and Börner, Katy (Eds.) (2004). Mapping Knowledge Domains. Proceedings of the National Academy of Sciences of the United States of America, 101(Suppl_1). http://www.pnas.org/content/vol101/suppl_1/ Börner, Katy, Sanyal, Soma and Vespignani, Alessandro (2007). Network Science. In Blaise Cronin (Ed.), ARIST, Information Today, Inc., Volume 41, Chapter 12, pp. 537-607. http://ivl.slis.indiana.edu/km/pub/2007-borner-arist.pdf Börner, Katy (2010) Atlas of Science. MIT Press. http://scimaps.org/atlas Scharnhorst, Andrea, Börner, Katy, van den Besselaar, Peter (2011) Models of Science Dynamics. Springer Verlag. 44
All papers, maps, tools, talks, press are linked from http://cns.iu.edu CNS Facebook: http://www.facebook.com/cnscenter Mapping Science Exhibit Facebook: http://www.facebook.com/mappingscience 45