Download
1 / 14
150 likes | 433 Views
Preference analysis. We often want to know how much farmers prefer one technology, management practice or strategy over others A simple way to do this is using a Preference Evaluation conducted with individual farmers and analysed by the focus group or village

E N D
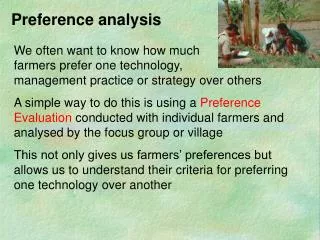
Preference analysis We often want to know how much farmers prefer one technology, management practice or strategy over others A simple way to do this is using a PreferenceEvaluationconducted with individual farmers and analysed by the focus group or village This not only gives us farmers’ preferences but allows us to understand their criteria for preferring one technology over another
Farmers’ name: Mary Sumbawa Date: 11 Feb 02 Interviewer: Papang Gabunada Technology options Ruzi Gamba Simuang Napier Marandu Weighting Positive criteria · · · · · Negative criteria · · · ·
Farmers’ name: Mary Sumbawa Date: 11 Feb 02 Interviewer: Papang Gabunada Technology options Ruzi Gamba Simuang Napier Marandu Weighting 3 6 20 2 19 Positive criteria · · · · · Negative criteria · · · ·
Farmers’ name: Mary Sumbawa Date: 11 Feb 02 Interviewer: Papang Gabunada Technology options Ruzi Gamba Simuang Napier Marandu Weighting 3 6 20 2 19 Positive criteria ·soft leaves ·easy seed production ·stays green in dry season ·high yield in the wet season ·animals like it ·good seed ·easy to cut ·high yield ·stays green in dry season ·liked by animals Negative criteria ·turns brown in dry season ·low yield ·could be a weed ·becomes stemmy if not cut frequently ·leaves get brown spots ·needs fertiliser ·dies during the dry season ·too much stem ·needs fertiliser
Preference analysis Preference evaluation is goodwhen you do not understand farmers’criteria for evaluating the technologies they are testing For it to work well you need to use good questioning skills (using both open and probing questions and not using leading questions)
Preference analysis Sometimes we may already have avery clear understanding of whatcriteria farmers will use to choose one technology over another In this case, another tool (Matrix Evaluation) can be useful. In Matrix Evaluation, a set of technologies appears down the side of the matrix and the criteria for evaluating these across the top. Farmers do weightings of each criterion for all the technologies
Preference analysis – How to analyse the data • Data can be analysed for: • mean preferences • preferences of particular groups in the village • importance of each criterion used by farmers
Results – Livestock Problems High Least Significant Difference Bars Importance Low
Preference analysis – How to analyse the data As well as YOU analysing the datapresent it back to all the farmers anddiscuss what the results mean Avoid concentrating on just the average results but try to understand the reasons for the variability in the data
Preference analysis – A note of caution! Preference analysis can be done by a group of farmers BUT you need to be sure that everyone in the group has the same (or very similar) opinions about the technologies Otherwise, you will end up with the preferences of only the dominant people in the group Remember: there is no “average” farmer!
Click the back button on your browser to return to the main menu


![Preference Elicitation [Conjoint Analysis]](https://cdn2.slideserve.com/5322185/preference-elicitation-conjoint-analysis-dt.jpg)