Download
1 / 15
150 likes | 305 Views
Teaching Statistics in a Spreadsheet Environment using Simulation. Graham Barr Leanne Scott Department of Statistical Sciences. Research Development and Output: Conference presentations. SASA conference, Stellenbosch , November 2007 . First Year Statistics Teaching with Spreadsheets .

E N D
Teaching Statistics in a Spreadsheet Environment using Simulation Graham Barr Leanne Scott Department of Statistical Sciences
Research Development and Output: Conference presentations • SASA conference, Stellenbosch, November 2007. First Year Statistics Teaching with Spreadsheets. • UCT Educational Colloquia, 2007 and 2008. • ICOTS-8 International Conference on Teaching Statistics, July 2010, Ljubljana, Slovenia. Teaching fundamental statistical concepts using simulation: experiences with this approach in South Africa and Australia. • OZCOTS- 7th Australian Conference on Teaching Statistics, December 2010, Fremantle, Australia. Spreadsheets and simulation – A new way forward for teaching statistics. • IJAS , June 2011, Prague, Czech Republic. Teaching Statistics via Active Learning in Spreadsheets. • ORSSA Annual conference, September 2011, Victoria Falls, Zimbabwe. Spreadsheet based methods for the teaching of Statistical and OR methodologies.
Research Development and Output: Peer Reviewed Papers • Barr, G.D.I. and Scott, L. A new approach to teaching fundamental statistical concepts and an evaluation of its application at UCT. SA Statist. J.,42,143-170, 2008. • Barr, GDI and Scott, L. Spreadsheets and simulation – a new way forward for teaching statistics. Accepted for publication in peer reviewed Proceedings, Ozcots2010 • Barr, GDI and Scott, L. Teaching Statistics in a Spreadsheet environment using simulation. Spreadsheets in Education, Vol 4, (3), 2011. [369 full text downloads of this paper since publication in April, 2011 in this eJournal] • Barr, GDI and Scott, L. An active learning exercise for students: Demonstrating the effects of correlation on variability reduction and an application to share portfolio construction. Spreadsheets in Education. Submitted Nov 2011. Under review.
Context • Poor mathematical skills • Complications of poor language skills • Large classes • Questionnaire administered to 700 STA1000S students: • only 20% could correctly compute a simple product calculation by cancellingcommon terms • 88% could calculate the correct change from R20 after a single purchase • 59% could divide 570 by 9, without using a calculator • 73% said they had ‘used Excel before’ but only 20% could calculate the square root of a column of numbers • 95% said ability to do mental arithmetic was a useful skill • 63% said they did not have this skill(!)
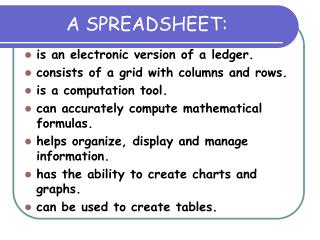
Teaching mathematical and statistical principles through a spreadsheet platform offers significant advantages: • Spreadsheet structure develops a general algebraic way of thinking • Row and column storage of numerical information, with linkages through formulae, and associated rich graphical depiction of data • “Observe” repeated statistical experiments (simulation) • “View” the notions of statistical distributions and randomness • Demonstrate the concepts of theoretical (statistical models) and empirical distributions
Introducing the concept of a distribution • Using basic spreadsheet functions : • Generate n random numbers between 0 and 1 • Calculate a frequency table for the generated numbers • Plot the frequency table as a histogram • Observe the pattern of the histogram as n increases • Use the F9 key to repeat experiments • Discussion: pattern; distribution; underlying population; sampling; effect of sample
Building on the spreadsheet foundation: VBA simulations • A package of slick push-button VBA programs which demonstrate key statistical concepts • Marry concepts of sampled (empirical) data with theoretical probability distributions • Demonstrate effect of sample size • Demonstrate patterns of effect associated with varying parameter values • Example: The Central Limit Theorem…
Using spreadsheets to create learning platforms in lab based tutorials • Introstat… introduction to statistical modelling and testing • Use Excel spreadsheets to allow students to “discover” theory • Use power of Excel to repeat experiments and randomly generate large amounts of data • Examples of tutorials: • (i) What’s a distribution? • (ii) What’s a statistic? • (iii) So random variables have distributions? What does that mean?! • (iv) Sampling distribution …huh?
Tutorial 1: What’s a distribution? • Students generate a set of eg 20 random numbers from a Uniform dbn • Set up bins and calculate frequencies in the bins • Calculate mean, median, range and sd of sample • Plot histogram of sample • Take picture and summary stats to tutorial • Jointly the students and tutor plot a histogram of (i) all the generated random numbers (ii) all the sample means
Tutor feedback… Hi Leanne, I had my first group today and it was really exciting, the students had more to say about distributions than I expected. There was a student that actually explained the Central Limit theorem without knowing/realising it. I was also impressed by the questions and debates they raised when struggling to understand why their histograms looked the way they did and why the distribution of the means looked bell shaped. Overall everyone participated and no one shied away when asked to comment on their histograms, I think this tut left them with a lot of excitement, and for some maybe a bit of anxiety as well. …
Tutorial 2: What’s a statistic? • students generate data from a Uniform dbn and insert an outlier • they look at the effect of outliers of different magnitudes on different measures of centrality • statistics have different properties and can therefore tell different stories
Tutorial 3: the sampling dbn of x bar • Generate 50 samples of data (n=30) from eg a Normal dbn • Calculate the sample means for the 50 samples • Plot the sample means • What is the expected (theoretical) mean of the samples? • What is the expected (theoretical) variance of the samples? • What is the observed (empirical) mean and variance of the generated samples? • In theory, what proportion of the sample means do we expect to find within 1 sd of the mean? • In practice, what proportion do you observe? • Perform hypothesis tests on each sample of data, testing whether the true mean=theoretical value
Feedback… “Ohhh….so that’s what is meant by the distribution of x bar?!” “So do you think you understood what was meant by prior to doing this spreadsheet exercise?” “??....How could I have understood that?!?”
Conclusions • Spreadsheets provide an effective medium for conveying statistical principles • Spreadsheets reinforce sound algebraic thinking • Teaching statistics via theory and associated paper exercises based on theoretical distributions can provide misleadingly good results • Spreadsheets allow us to mimic repeated experiments which provides an experiential way to teach statistics • Demonstrating statistical concepts in this way reduces dependency on subtleties/treacheries of language
Further Development • Dissemination and debate: UCT open-source material ; conferences and colloquia; (e)publications • Assessment: qualitative emphasis, focus groups • Supplementary notes for textbook • Extension to senior level statistics teaching • Video lectures? • Language: constructing meaning in statistics