Download
1 / 50
610 likes | 967 Views
Chapter 7. Flexible Budgets and Overhead Analysis. Static Budgets and Performance Reports. Hmm! Comparing static budgets with actual costs is like comparing apples and oranges. Static budgets are prepared for a single, planned level of activity.

E N D
Chapter7 Flexible Budgets and Overhead Analysis
Static Budgets and Performance Reports Hmm! Comparingstatic budgets withactual costs is likecomparing applesand oranges. Static budgets are prepared for a single, planned levelof activity. Performance evaluation is difficult when actual activity differs from the planned level of activity. Let’s look at CheeseCo.
Static Actual Budget Results Variances Machine hours 10,000 8,000 Variable costs Ind irect labor $ 40,000 $ 34,000 Indirect materials 30,000 25,500 Power 5,000 3,800 Fixed costs Depreciation 12,000 12,000 Insurance 2,000 2,050 Total overhead costs $ 89,000 $ 77,350 Static Budgets and Performance Reports CheeseCo
Static Actual Budget Results Variances Machine hours 10,000 8,000 2,000 U Variable costs Ind irect labor $ 40,000 $ 34,000 $6,000 F Indirect materials 30,000 25,500 4,500 F Power 5,000 3,800 1,200 F Fixed costs Depreciation 12,000 12,000 0 Insurance 2,000 2,050 50 U $11,650 F Total overhead costs $ 89,000 $ 77,350 Static Budgets and Performance Reports CheeseCo U = Unfavorable variance CheeseCo was unable to achieve the budgeted level of activity.
Static Actual Budget Results Variances Machine hours 10,000 8,000 2,000 U Variable costs Ind irect labor $ 40,000 $ 34,000 $6,000 F Indirect materials 30,000 25,500 4,500 F Power 5,000 3,800 1,200 F Fixed costs Depreciation 12,000 12,000 0 Insurance 2,000 2,050 50 U $11,650 F Total overhead costs $ 89,000 $ 77,350 Static Budgets and Performance Reports CheeseCo F = Favorable variance that occurs when actual costs are less than budgeted costs.
Static Actual Budget Results Variances Machine hours 10,000 8,000 2,000 U Variable costs Ind irect labor $ 40,000 $ 34,000 $6,000 F Indirect materials 30,000 25,500 4,500 F Power 5,000 3,800 1,200 F Fixed costs Depreciation 12,000 12,000 0 Insurance 2,000 2,050 50 U $11,650 F Total overhead costs $ 89,000 $ 77,350 Static Budgets and Performance Reports CheeseCo Since cost variances are favorable, havewe done a good job controlling costs?
Actual activity is belowbudgeted activity which is unfavorable. So, shouldn’t variable costsbe lower if actual activityis lower? Static Budgets and Performance Reports I don’t think Ican answer thequestion usinga static budget.
Static Budgets and Performance Reports • The relevant question is . . . “How much of the favorable cost variance isdue to lower activity, and how much is due to good cost control?” • To answer the question,we mustthe budget to theactual level of activity.
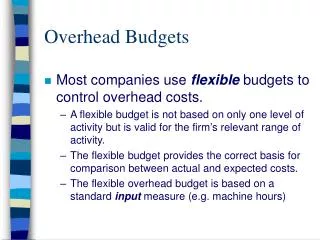
Flexible Budgets Show revenues and expensesthat should have occurred at theactual level of activity. May be prepared for any activity level in the relevant range. Reveal variances due to good cost control or lack of cost control. Improve performance evaluation.
Flexible Budgets Central Concept If you can tell me what your activity wasfor the period, I will tell you what your costs and revenue should have been.
Preparing a Flexible Budget To a budget we need to know that: • Total variablecosts changein direct proportion to changes in activity. • Total fixedcosts remainunchanged within therelevant range. Variable Fixed
Preparing a Flexible Budget Let’s prepare budgets for CheeseCo.
Preparing a Flexible Budget CheeseCo Cost Total Flexible Budgets Formula Fixed 8,000 10,000 12,000 Per Hour Cost Hours Hours Hours Machine hours 8,000 10,000 12,000 Variable costs are expressed as a constant amount per hour. $40,000 ÷ 10,000 hours is$4.00 per hour. Variable costs Indirect labor 4.00 $ 32,000 Indirect material 3.00 24,000 Power 0.50 4,000 Total variable cost $ 7.50 $ 60,000 Fixed costs Fixed costs areexpressed as atotal amount. Depreciation $ 12,000 Insurance 2,000 Total fixed cost Total overhead costs
Cost Total Flexible Budgets Formula Fixed 8,000 10,000 12,000 Per Hour Cost Hours Hours Hours Machine hours 8,000 10,000 12,000 Variable costs Indirect labor 4.00 $ 32,000 Indirect material 3.00 24,000 Power 0.50 4,000 Total variable cost $ 7.50 $ 60,000 Fixed costs $4.00 per hour × 8,000 hours = $32,000 Depreciation $ 12,000 Insurance 2,000 Total fixed cost Total overhead costs Preparing a Flexible Budget CheeseCo
Cost Total Flexible Budgets Formula Fixed 8,000 10,000 12,000 Per Hour Cost Hours Hours Hours Machine hours 8,000 10,000 12,000 Variable costs Indirect labor 4.00 $ 32,000 $ 40,000 $ 48,000 Indirect material 3.00 24,000 30,000 36,000 Power 0.50 4,000 5,000 6,000 Total variable cost $ 7.50 $ 60,000 $ 75,000 $ 90,000 Fixed costs Depreciation $ 12,000 $ 12,000 $ 12,000 $ 12,000 Insurance 2,000 2,000 2,000 2,000 Total fixed cost $ 14,000 $ 14,000 $ 14,000 Total overhead costs $ 74,000 $ 89,000 $ 104,000 Preparing a Flexible Budget CheeseCo
Cost Total Flexible Budgets Formula Fixed 8,000 10,000 12,000 Per Hour Cost Hours Hours Hours Machine hours 8,000 10,000 12,000 Variable costs Indirect labor 4.00 $ 32,000 $ 40,000 $ 48,000 Indirect material 3.00 24,000 30,000 36,000 Power 0.50 4,000 5,000 6,000 Total variable cost $ 7.50 $ 60,000 $ 75,000 $ 90,000 Fixed costs Depreciation $ 12,000 $ 12,000 $ 12,000 $ 12,000 Insurance 2,000 2,000 2,000 2,000 Total fixed cost $ 14,000 $ 14,000 $ 14,000 Total overhead costs $ 74,000 $ 89,000 $ 104,000 Preparing a Flexible Budget CheeseCo Total fixed costsdo not change inthe relevant range.
Flexible BudgetPerformance Report Let’s prepare a budget performance report for CheeseCo.
Flexible BudgetPerformance Report CheeseCo Cost Total Flexible budget is prepared for thesame activity level (8,000 hours) as actually achieved. Formula Fixed Flexible Actual Per Hour Costs Budget Results Variances Machine hours 8,000 8,000 0 Variable costs Indirect labor $ 4.00 $ 32,000 $ 34,000 Indirect material 3.00 24,000 25,500 Power 0.50 4,000 3,800 Total variable costs $ 7.50 $ 60,000 $ 63,300 Fixed Expenses Depreciation $ 12,000 $ 12,000 $ 12,000 Insurance 2,000 2,000 2,050 Total fixed costs $ 14,000 $ 14,050 Total overhead costs $ 74,000 $ 77,350
Cost Total Formula Fixed Flexible Actual Per Hour Costs Budget Results Variances Machine hours 8,000 8,000 0 Variable costs Indirect labor $ 4.00 $ 32,000 $ 34,000 $ 2,000 U Indirect material 3.00 24,000 25,500 1,500 U Power 0.50 4,000 3,800 200 F Total variable costs $ 7.50 $ 60,000 $ 63,300 $ 3,300 U Fixed Expenses Depreciation $ 12,000 $ 12,000 $ 12,000 0 Insurance 2,000 2,000 2,050 50 U Total fixed costs $ 14,000 $ 14,050 50 U Total overhead costs $ 74,000 $ 77,350 $ 3,350 U Flexible BudgetPerformance Report CheeseCo
Flexible BudgetPerformance Report Remember the question: “How much of the total variance is due to activityand how much is due tocost control?”
Static Actual Budget Results Variances Machine hours 10,000 8,000 2,000 U Variable costs Ind irect labor $ 40,000 $ 34,000 $6,000 F Indirect materials 30,000 25,500 4,500 F Power 5,000 3,800 1,200 F Fixed costs Depreciation 12,000 12,000 0 Insurance 2,000 2,050 50 U $11,650 F Total overhead costs $ 89,000 $ 77,350 Static Budgets and Performance How much of the $11,650 is due to activity and how much is due to cost control?
Flexible BudgetPerformance Report Overhead Variance Analysis Let’s place the flexible budget for 8,000 hours here. Difference between original static budgetand actual overhead = $11,650 F.
Flexible BudgetPerformance Report Overhead Variance Analysis Activity Cost control This $15,000F variance is due to lower activity. This $3,350U flexiblebudget variance is dueto poor cost control.
There are two primaryreasons for unfavorablevariable overhead variances: 1.Spendingtoo much for resources. 2. Using the resources inefficiently. What causesthe costcontrol variance? Flexible BudgetPerformance Report
Overhead Rates and Overhead Analysis Recall that overhead costs are assigned to products and services using a predetermined overhead rate (POHR): Assigned Overhead = POHR × Standard Activity Overhead from theflexible budget for thedenominator level of activity POHR = Denominator level of activity
Overhead Rates and Overhead Analysis – Example Let’s look at overhead rates in abudget for ColaCo.
Overhead Rates and Overhead Analysis – Example ColaCo prepared this budget for overhead: Total Variable Total Fixed Machine Variable Overhead Fixed Overhead Hours Overhead Rate Overhead Rate 2,000 $ 4,000 ? $ 9,000 ? 4,000 8,000 ? 9,000 ? Let’s calculate overhead rates. ColaCo applies overhead basedon machine hour activity.
Total Variable Total Fixed Machine Variable Overhead Fixed Overhead Hours Overhead Rate Overhead Rate 2,000 $ 4,000 $ 2.00 $ 9,000 ? 4,000 8,000 2.00 9,000 ? Overhead Rates and Overhead Analysis – Example ColaCo prepared this budget for overhead: Rate = TotalVariable Overhead ÷ Machine Hours This rate is constant at all levels of activity.
Total Variable Total Fixed Machine Variable Overhead Fixed Overhead Hours Overhead Rate Overhead Rate 2,000 $ 4,000 $ 2.00 $ 9,000 $ 4.50 4,000 8,000 2.00 9,000 2.25 Overhead Rates and Overhead Analysis – Example ColaCo prepared this budget for overhead: Rate = TotalFixedOverhead ÷ Machine Hours This rate decreases when activity increases.
Total Variable Total Fixed Machine Variable Overhead Fixed Overhead Hours Overhead Rate Overhead Rate 2,000 $ 4,000 $ 2.00 $ 9,000 $ 4.50 4,000 8,000 2.00 9,000 2.25 Overhead Rates and Overhead Analysis – Example ColaCo prepared this budget for overhead: The total POHR is the sum ofthe fixed and variable ratesfor a given activity level.
Overhead Variances Let’s use the overhead rates, to determine variable and fixed overhead variances.
Variable Overhead Variances – Example ColaCo’s actual production for the period required 3,200 standard machine hours. Actual variable overhead incurred for the period was $6,740. Actual machine hours worked were 3,300. Compute the variable overhead spending and efficiency variances.
Variable Overhead Variances Actual Flexible Budget Flexible Budget Variable for Variable for Variable Overhead Overhead at Overhead at Incurred Actual Hours Standard Hours AH × AR AH × SR SH × SR Spending Variance EfficiencyVariance Spending variance =AH(AR - SR) Efficiency variance =SR(AH - SH)
Variable Overhead Variances – Example Actual Flexible Budget Flexible Budget Variable for Variable for Variable Overhead Overhead at Overhead at Incurred Actual Hours Standard Hours 3,300 hours 3,200 hours × × $2.00 per hour $2.00 per hour $6,740 $6,600 $6,400 Spending variance$140 unfavorable Efficiency variance$200 unfavorable $340 unfavorable flexible budget total variance
Spending Variance Efficiency Variance Variable Overhead Variances – A Closer Look Results from paying moreor less than expected foroverhead items and from excessive usage ofoverhead items. Controlled bymanaging theoverhead cost driver.
Overhead Variances Now let’s turn our attention tofixed overhead.
Total Variable Total Fixed Machine Variable Overhead Fixed Overhead Hours Overhead Rate Overhead Rate 2,000 $ 4,000 $ 2.00 $ 9,000 $ 4.50 4,000 8,000 2.00 9,000 2.25 Overhead Rates and Overhead Analysis – Example ColaCo prepared this budget for overhead: What is ColaCo’s fixed overhead rate for an estimated activity of 3,000 machine hours?
Total Variable Total Fixed Machine Variable Overhead Fixed Overhead Hours Overhead Rate Overhead Rate 2,000 $ 4,000 $ 2.00 $ 9,000 $ 4.50 4,000 8,000 2.00 9,000 2.25 Overhead Rates and Overhead Analysis – Example ColaCo prepared this budget for overhead: What is ColaCo’s fixed overhead rate for an estimated activity of 3,000 machine hours? Fixed Overhead Rate FR = $9,000 ÷ 3,000 machine hours FR = $3.00 per machine hour
Fixed Overhead Variances – Example ColaCo’s actual production required 3,200 standard machine hours. Actual fixed overhead was $8,450. Compute the fixed overhead budget and volume variances.
Fixed Overhead Variances Actual Fixed Fixed Fixed Overhead Overhead Overhead Incurred Budget Applied SH × FR Budget Variance VolumeVariance FR = Standard Fixed Overhead RateSH = Standard Hours Allowed
Fixed Overhead Variances – Example Actual Fixed Fixed Fixed Overhead Overhead Overhead Incurred Budget Applied SH × FR 3,200 hours × $3.00 per hour $8,450 $9,000 $9,600 Budget variance$550 favorable Volume variance$600 favorable
Budget Variance Volume Variance Fixed Overhead Variances –A Closer Look Results from paying moreor less than expected foroverhead items. Results from operatingat an activity leveldifferent from thedenominator activity.
Overhead Variances Let’s look at a graph showing fixed overhead variances. We will use ColaCo’s numbers from the previous example.
Fixed Overhead Variances Cost Fixed overhead applied to products Volume 3,000 Hours ExpectedActivity 3,200 StandardHours
Fixed Overhead Variances 3,200 machine hours × $3.00 fixed overhead rate Cost $9,600 applied fixed OH $9,000 budgeted fixed OH $8,450 actual fixed OH Fixed overhead applied to products Volume 3,000 Hours ExpectedActivity 3,200 StandardHours
Fixed Overhead Variances 3,200 machine hours × $3.00 fixed overhead rate Cost $600FavorableVolume Variance $9,600 applied fixed OH { { $9,000 budgeted fixed OH { $8,450 actual fixed OH $8,450 actual fixed OH $550FavorableBudget Variance Fixed overhead applied to products Volume 3,000 Hours ExpectedActivity 3,200 StandardHours
VolumeVariance Volume Variance – A Closer Look Results when standard hoursallowed for actual output differsfrom the denominator activity. Unfavorablewhen standard hours< denominator hours Favorablewhen standard hours> denominator hours
VolumeVariance Does not measure over- or under spending Explainable by and controllable only throughactivity Volume Variance – A Closer Look Results when standard hoursallowed for actual output differsfrom the denominator activity. Unfavorablewhen standard hours< denominator hours Favorablewhen standard hours> denominator hours
Overhead Variances and Under- or Overapplied Overhead Cost In a standardcost system: Unfavorablevariances are equivalentto underapplied overhead. Favorablevariances are equivalentto overapplied overhead. The sum of the overhead variancesequals the under- or overappliedoverhead cost for a period.
End of Chapter 11 I’m here toyour budget. Are you ready to ante up?