Download
1 / 50
500 likes | 602 Views
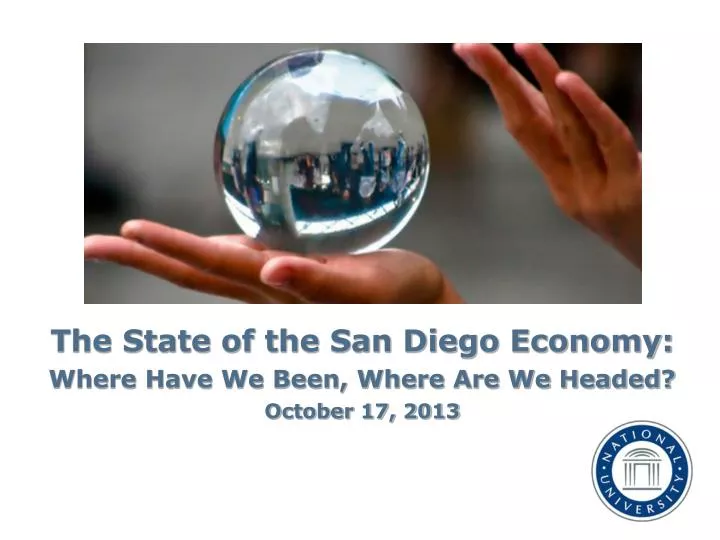
The State of the San Diego Economy: Where Have We Been, Where Are We Headed? October 17, 2013. Welcome Dr. Ronald Uhlig Dean, School of Business and Management. Introduction Dr. Michael R. Cunningham President, National University Chancellor, National University System. Presentation

E N D
The State of the San Diego Economy: Where Have We Been, Where Are We Headed? October 17, 2013
Welcome Dr. Ronald Uhlig Dean, School of Business and Management
Introduction Dr. Michael R. Cunningham President, National University Chancellor, National University System
Presentation Kelly Cunningham Senior Fellow and Economist, National University System
Kelly CunninghamEconomist, Senior Fellowwww.nusinstitute.org The State of the San Diego Economy: Where Have We Been, Where Are We Headed? October 17, 2013
The State of the San Diego Economy: • Great Recession “ended” in 2009 • National indicators of recovery • State and regional indicators • San Diego’s economic interdependence and independence/strengths and weaknesses • Industries • Jobs • San Diego demographics • Our economic outlook: opportunities • San Diego region • National University • Individual
Debt Limit/Default – October 17, 2013 • If we hit this date without raising the debt limit the U.S. is not going to automatically default on the debt. • At this time, the Treasury would have to start prioritizing payments, meaning picking and choosing who gets paid first. • If a government default occurs, it will be due to the government’s unwillingness to pay, not on ability to pay. • There is plenty of cash on hand to make debt obligation payments, but there is not enough money to pay for all government programs. Congress should eliminate programs that can’t be justified • Raising the debt limit amounts to putting off paying the government’s bills. • Borrowing more and going further into debt only perpetuates the day of reckoning when we lose the world reserve currency status. • This would be the most traumatic event that could happen to the US, worse than Pearl Harbor, 9/11, and the 2008 financial collapse; and we are dangerously approaching this possibility. • “The fact that we are here today to debate raising America’s debt limit is a sign of leadership failure. It is a sign that the U.S. Government can’t pay its own bills. It is a sign that we now depend on ongoing financial assistance from foreign countries to finance our Government’s reckless fiscal policies.” - Senator Barack Obama, 2006
Alternative measures of labor underutilization3rdQtr, 2012 through 2ndQtr 2013 Averages U-1: Persons unemployed 15 weeks or longer, as a percent of the civilian labor force. U-2: Job losers and persons who completed temporary jobs, as a percent of the civilian labor force. U-3: Total unemployed, as a percent of the civilian labor force (this is the definition used for the official unemployment rate). U-4: Total unemployed plus discouraged workers. U-5: Includes U-4 plus all other marginally attached workers. U-6: Includes U-5 plus total employed part time for economic reasons.
Change in U.S. Employment by Age 55+ year olds: 34% of workers in 2013 55+ year olds: 25% of workers in 2007
Comparison of Annual Change in GDPSAN DIEGO, California, U.S.
Location Quotient • Location quotient (LQ) is a way of quantifying how concentrated a particular industry, cluster, occupation, or demographic group is in a region as compared to the nation. • It can reveal what makes a particular region unique in comparison to the national average. • Location Quotient formula = (SD industry employment / SD total employment) (U.S. Industry employment / U.S. total employment) • LQ > 1.0 San Diego has higher concentration of production or employment the national average. • LQ = 1.0 San Diego has the same share of regional production or employment as the nation. • LQ < 1.0 San Diego has a lower concentration of production or employment the national average.
San Diego, California, U.S. Jobs Nonfarm payroll employment seasonally adjusted
Change in San Diego Jobs by Industry Sectors, August 2012- August 2013
Change in Jobs among Top-Five San Diego Defense-Dependent Industries vs. All Other Private Sector Industries
San Diego International Trade with Mexico and Rest of the World
San Diego Industry Employment Change San Diego technology companies account for:Average Wage (2012) Establishments: 6% Employment: 11% San Diego (overall) $54,000 Payrolls: 21% Average Wage: 190% Tech Average $102,600
Ratio of Median Selling Home Price to Median Household Income
Forecasting is a lot like trying to drive a car while only being able to see out the rear view mirror. - Anonymous
www.nusinstitute.org Our Mission The Institute is a non-partisan organization that formulates and promotes high quality economic, policy, and public-opinion research.
Thank you for coming! Questions? Dr. Ronald Uhlig Dean, School of Business and Management