Download
1 / 23
230 likes | 469 Views
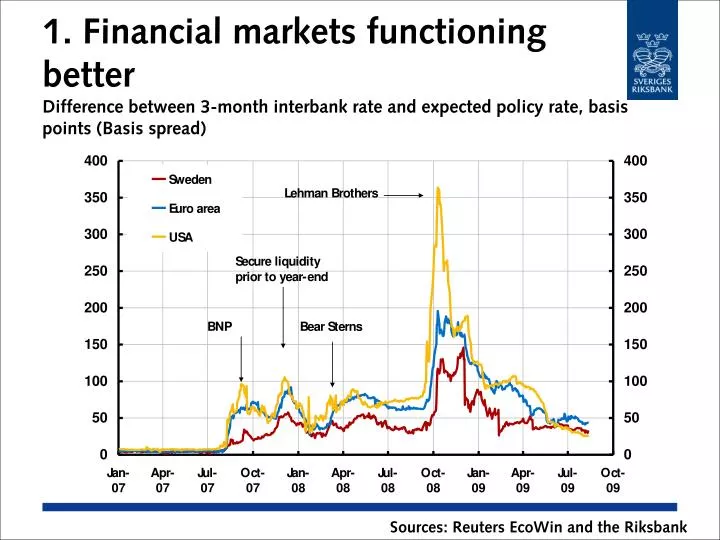
1. Financial markets functioning better Difference between 3-month interbank rate and expected policy rate, basis points (Basis spread). Sources: Reuters EcoWin and the Riksbank. 2. Loan losses increasing SEK billion net, totalled over four quarters, fixed prices, 31 March 2009.

E N D
1. Financial markets functioning betterDifference between 3-month interbank rate and expected policy rate, basis points (Basis spread) Sources: Reuters EcoWin and the Riksbank
2. Loan losses increasingSEK billion net, totalled over four quarters, fixed prices, 31 March 2009 Source: Finansial Stability Report 2009:1, the Riksbank
3. World GDP growthAnnual percentage change Sources: The IMF and the Riksbank Note. The broken column represents the Riksbank’s forecast.
4. Slow recoveryQuarterly changes in per cent calculated as annual rate, seasonally-adjusted data Note. Broken columns represent the Riksbank’s forecasts in July 2009. Sources: Bureau of Economic Analysis, Eurostat and the Riksbank
5. The oil price, Brent crude USD per barrel Sources: Intercontinental Exchange and the Riksbank Note. Broken lines represent the Riksbank’s forecasts.
240 240 Food Other agricultural products 220 220 Metals Total 200 200 180 180 160 160 140 140 120 120 100 100 80 80 60 60 00 01 02 03 04 05 06 07 08 09 10 6. Commodity pricesUSD, Index 2000 = 100 Source: The Economist
7. Consumer prices USAAnnual percentage change Source: Bureau of Labor Statistics and the OECD
8. Real house prices, USAIndex 1950 = 100 Note. Outcome up to end of Q1 2009. Source: Robert J. Schiller, Princeton University
70 70 65 65 60 60 55 55 50 50 45 45 40 40 35 35 30 30 Sweden Euro area 25 25 USA 20 20 00 01 02 03 04 05 06 07 08 09 10 9. Signs of a turnaroundPurchasing managers’ index, index above 50 indicates growth Sources: Institute for Supply Management, NTC Research Ltd and the NIER
10. Consumer prices euro areaAnnual percentage change Sources: Eurostat and the OECD
11. GDP abroadAnnual percentage change Source: IMF July 2009
12. GDP in SwedenAnnual percentage change Sources: Statistics Sweden and the Riksbank Note. Broken columns represent the Riksbank’s forecasts.
120 120 Survey indicator Mean value 115 115 +/- one standard deviation 110 110 105 105 100 100 95 95 90 90 85 85 80 80 75 75 70 70 00 01 02 03 04 05 06 07 08 09 10 13. Survey indicator Index Source: National Institute of Economic Research (NIER)
70 70 65 65 60 60 55 55 50 50 45 45 40 40 35 35 30 30 Sweden Euro area 25 25 USA 20 20 00 01 02 03 04 05 06 07 08 09 10 14. Signs of a turnaroundPurchasing managers’ index, index above 50 indicates growth Sources: Institute for Supply Management, NTC Research Ltd and the NIER
15. Employment Thousands, EU definition, 15-74 years of age, seasonally-adjusted data Note: The dotted line indicates the Riksbank’s forecast. Data prior to 2001 has been chained by the Riksbank Sources: Statistics Sweden and the Riksbank
16. UnemploymentPercentage of workforce, EU definition, 15-74 years of age, seasonally-adjusted data Note: The dotted line indicates the Riksbank’s forecast. Data prior to 2001 has been chained by the Riksbank Sources: Statistics Sweden and the Riksbank
5 5 CPI CPIF 4 4 3 3 2 2 1 1 0 0 -1 -1 -2 -2 00 01 02 03 04 05 06 07 08 09 10 11 12 17. Inflation close to targetAnnual percentage change Sources: Statistics Sweden and the Riksbank Note. Broken lines represent the Riksbank’s forecasts.
18. Exchange ratesSEK per EUR and per USD respectively Source: Reuters EcoWin
7 7 6 6 5 5 4 4 3 3 2 2 1 1 0 0 -1 -1 Unit labour costs -2 -2 Labour costs per hour Productivity -3 -3 94 96 98 00 02 04 06 08 10 19. Unit labour costsAnnual percentage change Sources: Statistics Sweden and the Riksbank Note. Broken lines and columns represent the Riksbank’s forecasts.
20. Inflation expectationsAnnual percentage change Sources: The NIER and Prospera Research AB
21. Current account and public financesPer cent of GDP Sources: Statistics Sweden and the Riksbank Note. Broken lines represent the Riksbank’s forecasts.
22. Low repo rate over long period of timePer cent, quarterly average Source: The Riksbank Note. The uncertainty interval is calculated using historical forecasting errors.
23. Utilisation of resourcesPercentage deviation from the HP trend Sources: Statistics Sweden and the Riksbank Note: The dotted line refers to the Riksbank’s forecast.