Download
1 / 1
10 likes | 118 Views
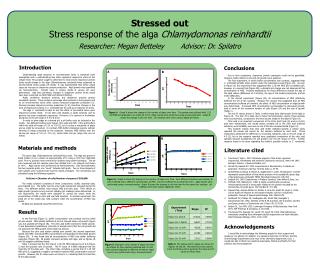
Stressed out Stress response of the alga Chlamydomonas reinhardtii Researcher: Megan Betteley Advisor: Dr. Spilatro. Conclusions Due to time constraints, chaperone protein expression could not be quantified. However, buffer effects on pH and cell growth were explored.

E N D
Stressed out Stress response of the alga Chlamydomonas reinhardtiiResearcher: Megan Betteley Advisor: Dr. Spilatro Conclusions Due to time constraints, chaperone protein expression could not be quantified. However, buffer effects on pH and cell growth were explored. The first experiment, in which buffer concentration was constant, suggested that C. reinhardtii exhibits linear growth under the parameters used (Figure 1A). As seen in Figure 1B, this experiment also suggested that 1.25 mM MES did not stabilize pH; however, in a second trial (Figure 2B), a dramatic pH change was not observed at this concentration of MES. Possible explanations for these differences include the age of the algal culture (difference of 2 months), the age of the media components, and pH meter difficulties. In the second experiment (Figure 2B), all concentrations of MES effectively buffered the pH of the samples. Because the second trial suggested that all MES concentrations buffered pH similarly, the effect of MES concentration on algal growth was determined. Increased MES concentration corresponded to decreased growth, both in terms of the maximum number of cells (Figure 2A) and the rate of growth (Table 1). The low R2 values shown in Table 1 reflect trend lines that loosely fit the data in Figure 2A. The poor fit is likely due to fewer hemocytometer counts; these samples were counted twice, compared to the three counts made for the data in Figure 1A. Citric acid is an important component of the Citric Acid Cycle (8) and so if citric acid were metabolized, one would expect unstable pH in the citric acid buffered solutions; such instability was seen in one of the four samples tested (Figure 3). This research implies that citric acid buffer inhibited growth; a similar study reported the lowest cell counts for the solution buffered by citric acid. Those researchers attributed the difference to increased metabolic costs in the pH range of 4-5 (3), but in the research reported here, qualitative comparison of the citric acid samples showed consistently low cell growth over the pH range of 4-6.5. Further research needs to be done regarding this buffer’s possible toxicity to C. reinhardtii. Introduction Understanding algal response to environmental stress is important both ecologically and in understanding how other organisms respond to stress at the cellular level. This project sought to determine to what extent chaperone protein levels would change in the alga Chlamydomonas reinhardtii when subjected to environmental stress (acidic pH levels). It was hypothesized that stress would cause an increase in chaperone protein production. Algal growth was quantified via hemocytometry. Growth rates in various media at various pH were determined. Had time permitted, changes in chaperone protein levels would have been examined via SDS PAGE and Western Blotting. Acidic conditions denature proteins, but chaperone proteins protect mesophilic species. These proteins encourage other proteins to fold properly and so an environmental stress often causes increased chaperone production (1). Stresses increase chaperone protein production (5; 9); therefore changes in the level of chaperone proteins in C. reinhardtii can be used as an indicator of stress. The alga C. reinhardtii is ideal to test the effect of pH-related stress upon chaperone protein levels. It has been well studied, is easily cultured, and its genome has been completely sequenced. Moreover, it is common in freshwater and grows in the pH range of 5.5 to 8.5 (6). In order to grow algae at a desired pH, a pH buffer must be included in the media. Two different buffers were tested: citric acid and MES. Citric acid buffers within the wide pH range of 2.14 to 7.39 (2), but it is also a metabolite of algae and so might be consumed. In contrast, MES buffers biological systems without harming or being consumed by the organism. However, MES buffers over the narrow pH range of 5.15 to 7.15 (2), which limits the pH range that can be tested. Acknowledgements I would like to acknowledge the following people for their support and guidance: my advisor, Dr. Spilatro; my capstone instructor, Dr. Brown; and the entire Biology Department (and most of the chemistry department, too). I would also like to thank my capstone classmates, friends and family for their patience and encouragement. Figure 1: Graph A shows the change in the number of algae over time. The system was buffered with 1.25 mM MES and adjusted to an initial pH of 6.5. Algal counts were performed using a hemocytometer. Graph B shows the change in pH over time. pH readings were done using a digital pH meter. Materials and methods The green alga Chlamydomonas reinhardtii was used. The alga was grown in liquid media (4) on a shaker at approximately 25°C using a 16:8 hour light/dark cycle. Five mL portions were removed for analysis using sterile technique. The pH was measured and the samples were then divided into 1 mL aliquots and frozen at -80°C. Algal counts were performed via hemocytometry. One hemocytometer has two separate grids; one “count” includes both grids. Two or three aliquots of each sample were counted twice and the results averaged. The cell density was calculated using the following equation: Cells/mL= (Number of cells/Number of squares)*250,000 The media solutions consisted of three components: buffer, essential salts, and chelated iron. The buffer was the only media component changed during the trials. Two different buffers were tested: MES and citric acid. Their effects on algal growth (growth curves) and pH stability (pH readings) were determined. In one experiment, the media were adjusted to various pH values while the concentration of MES or citric acid was held constant. In another experiment, the initial pH of the media was held constant while the concentration of MES was varied. All data was analyzed using Microsoft Excel. Literature cited Csermely P, Vigh L. 2007. Molecular aspects of the stress response: chaperones, membranes and networks [electronic resource]. New York (NY): Springer Science + Business Media, LLC. Farrell SO, Ranallo RT. 2000. Experiments in Biochemistry: A Hands-on Approach. Thomson Learning: Toronto (CA); p. 37-50. Gerloff-Elias A, Barua D, Molich A, Spijkerman E. 2006. Temperature- and pH- dependent accumulation of heat-shock proteins in the acidophilic green alga Chlamydomonas reinhardtii. FEMS Microbial Ecology 56: 345-354. Hudock GA. 1967. Experiments in Modern Genetics. John Wiley & Sons, Inc. McMullin TW, Hallberg RL. 1988. A highly evolutionarily conserved mitochondrial protein is structurally related to the protein encoded by the Escherichia coli groEL gene. Mol Cell Biol 8: 371-380. Messerli MA, Amaral-Zettler LA, Zettler E, Junh SK, Smith PJ, Sogin L. 2005. Life at acidic pH imposes an increased energetic cost for a eukaryotic acidophile. Journal of Experimental Biology 208: 2569-2579. Neidhardt FC, Phillips TA, VanBogelen RA, Smith MW, Georgalis Y, Subramanian AR. 1981. Identity of the B 56.5 protein, the A-protein, and the groE gene product of Escherichiacoli. J Bact 145: 513-520. Nelson DL, Cox MM. 2005. Lehninger Principles of Biochemistry. New York (NY): WH Freeman & Company; p. 601-626. Thompson MD, Paavola CD, Lenvik TR, Gantt JS. 1995.Chlamydomonas transcripts encoding three divergent plastid chaperonins are heat-inducible. Plant Molecular Biology 27(5): 1031-1035. Figure 2: Graph A shows the change in the number of algae over time. Four different solutions were tested; all were buffered with a different concentration of MES. All were buffered to an initial pH of 6.5. Algal counts were performed using a hemocytometer. Graph B shows the changes in pH over time for the same four systems. pH readings were done using a digital pH meter. Results In the first trial (Figure 1), buffer concentration was constant and the initial pH was varied. MES initially buffered at pH 6.5 showed linear cell growth (Figure 1A), but unstable pH (Figure 1B). The citric acid buffer seemed to inhibit growth. It was determined qualitatively (intensity of sample color) that the cell growth did not approach the MES growth levels (data not shown). Because the citric acid system yielded poor growth, the second experiment tested only MES. Increased MES concentration corresponded to decreased growth (Figure 2A). It was found that all concentrations of MES had similar buffering capacities (Figure 2B). All graphs represent samples with alga, and so figures 1B and 2B suggest conflicting trends. Table 1 showed that the first trial of 1.25 mM MES buffered to pH 6.5 (Figure 1) had the greatest rate of growth. The R2 value of 0.9958 indicated that the trend line fit the data well. The other trials, including a second trial of 1.25 mM MES pH 6.5, suggested a negative correlation between MES concentration and cell growth. However, the R2 values were not close to 1, indicating that the trend line fit the data loosely. Table 1: The slopes and R2 values are shown for Figures 1A and 2A. Microsoft Excel was used to insert trend lines and to generate the slope and R2 values for those lines. Figure 3: Changes in the number of algae over time are shown for four solutions buffered with 10 mM citric acid and adjusted to different pH values. Algal counts were performed using a hemocytometer.


