Download
1 / 25
250 likes | 353 Views
Cem Data Analysis And Use. Mark Janssen – Midwest RPO. Emissions Modeling Domain. LADCO Inventory. August 1999, January 2000 Future CEM for annual 2002 run when data available. Anthropogenic emissions based on USEPA’s 1999 National Emissions Inventory Version 2. Version 2 NEI Issues.

E N D
Cem Data Analysis And Use Mark Janssen – Midwest RPO
LADCO Inventory • August 1999, January 2000 • Future CEM for annual 2002 run when data available. • Anthropogenic emissions based on USEPA’s 1999 National Emissions Inventory Version 2
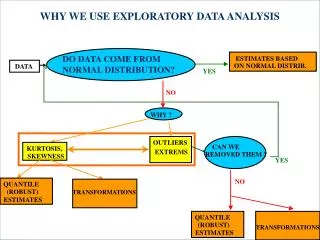
Version 2 NEI Issues • Point Sources • State ID’s replace ORIS ID’s • Temporal still weak in NEI, Flat • Few unreasonably high values in Florida, Michigan, and Colorado – Fixed/Removed • EGU inventory 6-7000 Tons/Day NOX lower than V2 Draft (removed double counting)
Using the Raw CEM Data • Prepare NIF2.0 model-ready point source emission files based on 1998 - 2000 CEM data • Need to match ID’s with 1999 NEI at LADCO • NEI base on State ID’s, CEM based on ORIS ID’s • Matching good for midwest, Poor elsewhere. • Huge 14Gig per year in NIF.
Report of CEM with no match in NEI for August 1999 • IL 5.6 TPD • IN .6 TPD • MI 13 TPD Eckert & Moores Park Station? • OH 1.5 TPD • WI 1.4 TPD • That’s real good! • Deleware/Nebraska lost over 50% of CEM Mass.
Dealing with Blanks • What to do about Missing or Zero Data • Blank emission records common. • New Tools replace blank records with zero emissions where there are pre-existing CEM records for that month • Lessens overall Point NOX Tons/Day variability • BaseB(24,500-37,800)~32000 Midpoint NOX TPD • BaseD(21,600-32,700)~25000 Midpoint NOX TPD
Why build Temporal Profiles From CEM? • CEM data is great for base year model validation. Answers the question: Can this photochemical/emissions modeling system duplicate reality • CEM Can Not be used in future year modeling. If facilty XYZ was closed on July 16th 2002 will it be closed on July 16th 2018? • So we must create conceptual and computation models to mimic the behavior of facilities so we can build appropriate future year inventories.
EH Pechan Temporal Effects • Based on 1998 - 2000 CEM data, create day-of-week and hourly profiles • Put Pechan profiles into models as NIF2.0 Point “EP” record types. • Ran with Version 2 of NEI99 • Raw Pechan data has Hourly Profiles by day of week and season • LADCO used Wednesday value for all days by season • Raw Pechan data has day of week by season. • Used Raw Pechan Data
Foundations of Future Temporal Models • Using 1998-2002 data to identify variations in load/emissions to classify as base load, peeking unit , or somewhere in between. • Establish month of year and hour of day profiles to show variability in emissions base on CEM • Apply temperature corrections on top of these to reflect daily min/max. • Identify units that are likely to change from peaking to base load based on growth assumptions. Change their temporal attributes to match.
MWRPO Future directions • Reanalyze 1998 – 2002 when it becomes available from EPA in RPO format. • Build profile generation tools we run ourselves to allow iterative process • Do new modeling (Base F?) • Work with MWRPO stakeholders to see how our predictions work?