Download
1 / 23
230 likes | 235 Views
This study aims to enhance short-term hydrological forecasts by combining ensemble quantitative precipitation forecasts (QPF) and streamflow models from the National Weather Service (NWS). The project involves collaboration between Stony Brook University, NWS offices at Upton and Mt. Holly, and the Mid-Atlantic River Forecast Center (MARFC). The models are run using data from the Passaic River basin and ensemble problems are corrected based on past performance.

E N D
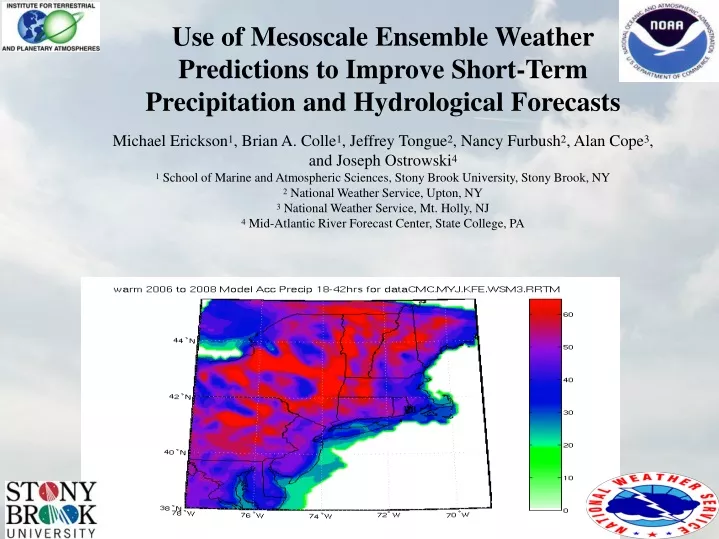
Use of Mesoscale Ensemble Weather Predictions to Improve Short-Term Precipitation and Hydrological Forecasts Michael Erickson1, Brian A. Colle1, Jeffrey Tongue2, Nancy Furbush2, Alan Cope3, and Joseph Ostrowski4 1 School of Marine and Atmospheric Sciences, Stony Brook University, Stony Brook, NY 2 National Weather Service, Upton, NY 3 National Weather Service, Mt. Holly, NJ 4 Mid-Atlantic River Forecast Center, State College, PA
High Ensemble Variability: Hanna 9/6/08 00Z Run 18-42 Hour Acc. Precip. “Observed” GFS Solution Select Short Range Ensemble Forecast Members Select Stony Brook Members
Project Goals • To improve short-term (0-48h) hydrological forecasts using a combination of ensemble quantitative precipitation forecasts (QPF) and streamflow models used by the National Weather Service (NWS). • Collaborative project between Stony Brook University (SBU), NWS offices at Upton, NY and Mt. Holly, and the Mid-Atlantic River Forecast Center (MARFC). • Run hydrologic models fed with SBU QPF data over various river basins such as the Passaic. • Correct ensemble problems based on how the models performed in the recent past. • Check to see how the ensemble correction performed for specific weather cases. Passaic Basin Lodi, NJ
0000 UTC 13-Member MM5/WRF Ensemble • 7 MM5 Members: • **WRF-NMM (Grell, MRF, Sice) • WRF-NMM (Grell, M-Y, Reis2) • GFS (Betts-Miller, M-Y, Sice) • GFS (KF2, MRF, Reis2) • NOGAPS (Grell, Blackadar, Sice) • CMC (KF2, M-T, Sice) • 18 Z GFS + FDDA (Grell, Blackadar, Sice) • 6 WRF-ARW Members: • **WRF-NMM (KF2, YSU, Ferrier) • WRF-NMM (Betts-Miller, M-Y, WSM3) • GFS (Grell, YSU, Ferrier) • GFS (KF2, M-Y, Ferrier) • NOGAPS (Betts-Miller, YSU, WSM3) • CMC (KF2, M-Y, WSM3) All runs integrated down to 12-km grid spacing to hour 48 ** MM5/WRF members are run down to 4-km grid spacing
NCEP SREF 21 Member Ensemble • Ensemble run 4 times per day (03z, 09z, 15z, 21z) but only the 21z run is considered for this study. • The SREF consists of the following: • - 10 ETA members at 32 km grid spacing. • - 5 with BMJ PBL and Ferrier MP. • - 5 with KF PBL and Ferrier MP. • - 5 RSM members at 45 km grid spacing. • - 3 with SAS PBL and Zhou GFS MP. • - 2 with RAS PBL and Zhou GFS MP. • - 3 WRF-NMM members at 40 km grid spacing. • - 3 WRF-ARW members at 45 km grid spacing. • Since the initial atmospheric state can never be perfectly known, SREF uses a breeding technique to account for uncertainty in initial conditions.
Stage IV and model details • NCEP Stage IV rain data at ~4 km resolution is available from 2001-present in • 1-hr, 6-hr, and 1 day increments. • Stage IV data consists of radar estimates and rain gauge data that were blended with some additional manual quality control. Accumulated rainfall between hours 18 and 42 of the model run were considered. • The Stage IV and SREF data were • interpolated to the 12 km MM5/WRF • model grid. • Regions sufficiently offshore were masked. • The 2006 to 2008 warm seasons • (5/1-8/31) were analysed. Total Stage IV Warm Season Precip.
Hydrological Multi-Model Ensemble Forecasts SBU, NCEP SREF, NAM, and GFS MARFC: Downscaling and Basin Averaging Upton, NY and Mount Holly WFO: Ingested into AWIPS 6hr accumulated QPF ingested into Ensemble Streamflow Prediction Data ingested into Site Specific for the Passaic Basin
Hanna Case – 9/6/08 00z (21z) Run Select SBU Members Select SREF Members SBU Ensemble Mean Stage IV Data SREF Ensemble Mean
Hanna Case – 9/6/08 00z (21z) Run KDXR ETA SREF Plume 9/5/08 21Z KDXR SBU MM5 Plume 9/6/08 00Z KDXR Non-ETA SREF Plume 9/5/08 21Z KDXR SBU WRF Plume 9/6/08 00Z
Hanna Case: Ensemble Streamflow Prediction 9/6/08 00z Run: Saddle River: Lodi, NJ River Response from Ensemble QPF from Ensemble 4” 3” 2” 1” 0” 12’ 10’ 8’ 6’ 4’ 2’ -33% of members predict major flooding -42% of members predict moderate flooding -58% of members predict flooding River Response: Mean and Spread Forecast and Observed River Height 10’ 8’ 6’ 4’ 2’ 0’ 12’ 10’ 8’ 6’ 4’ Ensemble Mean Flood Stage ~6.8’ Observed Flood Stage ~7.8’
April 2007 Case – 4/15/07 00z Run Select SBU Members Select SREF Members Stage IV Data SBU Ensemble Mean SREF Ensemble Mean
April 2007 Case – 4/15/07 00z Run KDXR SBU MM5 Plume 4/15/07 00Z KDXR ETA SREF Plume 4/14/07 21Z KDXR SBU WRF Plume 4/15/07 00Z KDXR Non-ETA SREF Plume 4/14/07 21Z
Model Error – Warm Season 2006 - 2008 18-42 Hr Acc. Precip MM5 WRF SBU Model Bias SBU Ensemble Ranking 2 1.5 1 0.5 0 SREF Model Bias SREF Ensemble Ranking 1.6 1.4 1.2 1 0.8 0.6 0.4 0.2 0 • SBU has a wet bias, but this is caused mostly by light QPF days • Some members outperform others for both ensembles
Model Error – Warm Season 2006 - 2008 18-42 Hr Acc. Precip MM5 WRF SBU Model Bias for Days > 1” 1.6 1.4 1.2 1 0.8 0.6 0.4 0.2 0 SREF Model Bias for Days > 1” 1.6 1.4 1.2 1 0.8 0.6 0.4 0.2 0 • SBU wet bias appears to be caused by a large number of light QPF events • Dry bias increases for both ensembles on heavier QPF days.
Warm Season – Grid Averaged Statistics Convective Peak Overestimated Avg Diurnal Cycle of Precip - SBU 0.030” 0.025” 0.020” 0.015” 0.010” 0.005” 0” AM PM AM Diurnal Cycle of Precip - SREF RSM/WRF Diurnal Cycle of Precip - SREF ETA 0.035” 0.030” 0.025” 0.020” 0.015” 0.010” 0.005” 0” 0.035” 0.030” 0.025” 0.020” 0.015” 0.010” 0.005” 0” AM PM PM AM PM AM
Spatial Bias Plots – Warm Season 2006 – 2008 18-42 Hr Acc. Precip sref.arw.n1 BMMY-ccm2.NEUS.avn SBU Ensemble Mean SREF Ensemble Mean
Rank Histograms 18-42 Hr Acc. Precip SBU Rank Histogram SREF Rank Histogram • Ensembles frequently suffer from dispersion problems, meaning that model variability is too great or small compared to reality. • Our Stony Brook Ensemble does not have enough variability and has a wet bias. SREF has the opposite problem, too much variability.
Post-Processing - Bayesian Model Averaging (BMA) • Bayesian Model Averaging (BMA Raftery et al. 2005) has been shown to correct some model deficiencies associated with reliability and dispersion. • BMA creates a probability density function (PDF) for each ensemble member depending on the uncertainty in the model forecast and weights the result based on its performance and uniqueness in the recent past. • The main advantages of BMA appear to be with probabilistic skill, although deterministic skill is also increased. PDF for Temperature PDF for Precipitation BMA weights each member based on past performance and assigns a range of potential values
BMA Results - Warm Season Weights at KJFK 18 -42 Hour Acc. Precip. BMA Weights for Precip - MM5 100% 80% 60% 40% 20% 0% BMA Weights for Precip - WRF 100% 80% 60% 40% 20% 0%
BMA – Future Work 0.35 0.30 0.25 0.20 0.15 0.10 0.05 0.00 Raw Rank Histogram Reliability Diagram 1 0.8 0.6 0.4 0.2 0 Raw Rank Histogram BMA Adjusted 1 2 3 4 5 6 7 8 9 10 BMA Rank Histogram 0.35 0.30 0.25 0.20 0.15 0.10 0.05 0.00 Raw Ensemble 0.0 0.2 0.4 0.6 0.8 1.0 • BMA has been shown to improve ensemble reliability and correct the rank histogram for precipitation in the Pacific Northwest (Sloughter et al. 2007). 0 0.1 0.2 0.3 0.4 0.5 0.6 0.7 0.8 0.9 1
Conclusions • The SBU ensemble has a general wet bias caused by overprediction of mainly light to moderate QPF events during the late afternoon. • The SREF ensemble has a dry bias and some members fail to properly simulate the diurnal convective cycle. • Soil moisture and PBL scheme may influence the model bias for the SBU ensemble. This will have to be looked into further. • The SBU ensemble suffers from a lack of variability, while the variability within the SREF ensemble is overinflated compared to the observations. • Bayesian Model Averaging may help improve the model output and provide probabilistic value for precipitation. • SBU and SREF ensemble data are currently being supplied to NWS WFO’s and the MARFC for hydrological predictions.
SBU Ensemble and a Positive Definite Moisture Transport Model MM5 WRF Positive Definite Moisture Transport


![I like [ hour / our ] team the best. hour our](https://cdn1.slideserve.com/2584921/slide1-dt.jpg)