Download
1 / 55
600 likes | 711 Views
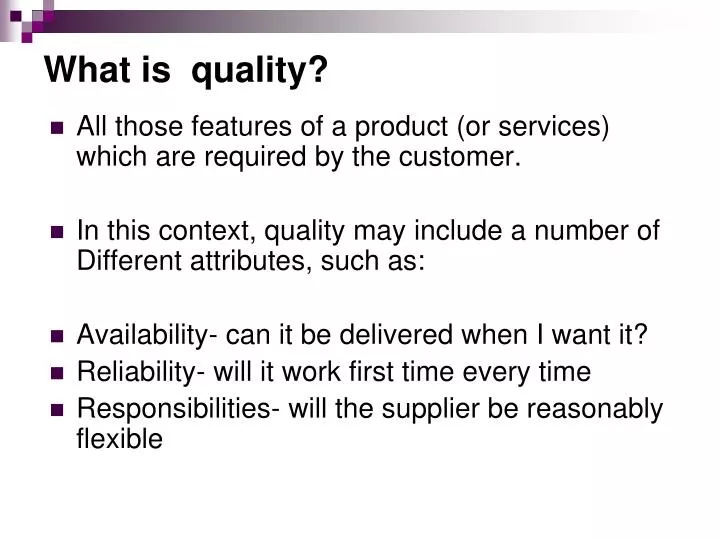
What is quality?. All those features of a product (or services) which are required by the customer. In this context, quality may include a number of Different attributes, such as: Availability- can it be delivered when I want it? Reliability- will it work first time every time

E N D
What is quality? • All those features of a product (or services) which are required by the customer. • In this context, quality may include a number of Different attributes, such as: • Availability- can it be delivered when I want it? • Reliability- will it work first time every time • Responsibilities- will the supplier be reasonably flexible
Competence- do the necessary skills and knowledge exist to perform the service? • Communication- can I contact the supplier easily and do they speak my language? • Credibility- do they inspire confidence? • Security- are their systems and procedures secure.
Why is quality important? The effectiveness of quality management has been shown to be one of the most important characteristics of successful companies. In recent years quality has become the key in determining many organizations’ position in respect of their competitive advantage. Improved quality can increase revenue and reduce costs, since:
Better quality improves the perceived image of a product or service and makes customers more likely to buy it. • Higher demand should result in higher sales volume and higher profits. • Higher quality in manufacturing should result in lower unit costs, with economies of scale in production and selling. • Higher quality in manufacturing should result in lower waste and defective rates, which will reduce production cost. • The volume of customer complaints should fall, and warranty claims should be lower. This will reduce costs. • Better quality in production should result in shorter processing times and less capital equipment requirements.
The cost of quality • A report into ‘ The effectiveness of the corporate overhead in British business ‘ by Develin & Partners (1989), estimates that the average cost of waste and mistakes in the UK represents 20% of controllable corporate overhead. • This includes the cost of ensuring and assuring quality, as well as the loss incurred when quality is not achieved. Quality costs can be classified as prevention cost, appraisal cost, internal failure cost and external failure cost.
Quality control Quality control is the traditional approach concerned with ensuring that actual quality, as measured, meets the target or benchmark standards that have been set. It is concerned with maintaining quality standards, rather than improving them and involves:
Establishing quality standards for a product or service. • Establishing procedures and processes that ought to ensure that these quality standards are met in a suitably high number of cases (in other words, quality acceptance standards are established) • Monitoring actual quality • Taking control action in cases where actual quality falls below the standard. • Procedures for inspecting and checking the quality of bought – in material’s and production output.
QUALITY ASSURANCE Quality assurance is the term used where a supplier guarantees the quality of goods supplied and allows the customer access while the goods are being manufactured. This is usually done through supplier quality assurance (SQA) officers, who control the specification of the goods supplied. Quality assurance may:
save purchasers quality control and production costs as items can be passed unchecked straight to production. This can give large savings in cost and time inflow production, and can facilitate Just- in- Time (Jit) production. • help companies to identify and remove the causes for poor quality goods before production instead of waiting for the end result • be particularly useful where extensive sub-contracting work is carried out, such as in the motor industry.
TOTAL QUALITY MANAGEMENT (TQM)Origins, Evolution & key elements
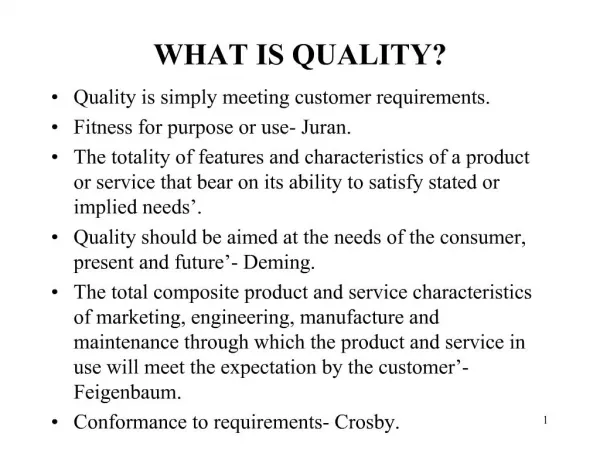
WHAT IS QUALITY? Quality is “fitness for use” (Joseph Juran) Quality is “conformance to requirements” (Philip B. Crosby) Quality of a product or services is its ability to satisfy the needs and expectations of the customer
WHAT IS QUALITY • FEDEX - “PERFORMANCE TO THE STANDARD EXPECTED BY THE CUSTOMER” • GENERAL SERVICES ADMINISTRATION - “MEETING THE CUSTOMER’S NEED THE FIRST TIME AND EVERY TIME” • BOEING - “PROVIDING CUSTOMERS WITH PRODUCTS AND SERVICES THAT CONSISTENTLY MEET THEIR NEEDS AND EXPECTATIONS”
WHAT IS QUALITY • US DEPARTMENT OF DEFENSE - “DOING THE RIGHT THING RIGHT THE FIRST TIME, ALWAYS STRIVING FOR IMPROVEMENT, AND ALWAYS SATISFYING THE CUSTOMER”. • QUALITY CAN BE DEFINED IN TERMS OF THE AGENT. WHO IS THE JUDGE OF QUALITY?
WHAT IS QUALITY • QUALITY INVOLVES MEETING OR EXCEEDING CUSTOMER EXPECTATIONS. • QUALITY APPLIES TO PRODUCTS, SERVICES, PEOPLE, PROCESSES, AND ENVIRONMENTS. • QUALITY IS AN EVER-CHANGING STATE (I.E., WHAT IS CONSIDERED QUALITY TODAY MAY NOT BE GOOD ENOUGH TO BE CONSIDERED QUALITY TOMORROW).
SIX BASIC CONCEPTS OF TQM 1. A COMMITTED AND INVOLVED MANAGEMENT TO PROVIDE LONG- TERM TOP-TO-BOTTOM ORGANIZATION SUPPORT 2. AN UNWAVERING FOCUS ON THE COSTOMER, BOTH INTERNALLY AND EXTERNALLY. 3. EFFECTIVE INVOLVEMENT AND UTILIZATION OF THE ENTIRE WORK FORCE.
SIX BASIC CONCEPTS OF TQM 4. CONTINUOUS IMPROVEMENT OF THE BUSINESS AND PRODUCTION PROCESS. 5. TREATING SUPPLIERS AS PARTNERS. 6. ESTABLISH PERFORMANCE MEASURES FOR THE PROCESSES.
THE TOTAL QUALITY APPROACH • TOTAL QUALITY IS AN APPROACH TO DOING BUSINESS THAT ATTEMPTS TO MAXIMIZE THE COMPETITIVENESS OF AN ORGANIZATION THROUGH THE CONTINUAL IMPROVEMENT OF THE QUALITY OF ITS PRODUCTS, SERVICES, PEOPLE, PROCESSES AND ENVIRONMENTS.
Evolution of Quality Management Salvage, sorting, grading, blending, corrective actions, identify sources of non-conformance Inspection Develop quality manual, process performance data, self-inspection, product testing, basic quality planning, use of basic statistics, paperwork control. Quality Control Quality systems development, advanced quality planning, comprehensive quality manuals, use of quality costs, involvement of non-production operations, failure mode and effects analysis, SPC. Quality Assurance Policy deployment, involve supplier & customers, involve all operations, process management, performance measurement, teamwork, employee involvement. TQM
The Deming Cycle or PDCA Cycle PLAN Plan a change to the process. Predict the effect this change will have and plan how the effects will be measured ACT DO Adopt the change as a permanent modification to the process, or abandon it. Implement the change on a small scale and measure the effects CHECK Study the results to learn what effect the change had, if any.
W. Edwards Deming’s 14 Points 1) Create constancy of purpose towards improvement of product and services. Adopt the new philosophy. We can no longer live with commonly accepted levels of delays, mistakes, defective workmanship. Cease dependence on mass inspection. Require, instead, statistical evidence that quality is built in. End the practice of awarding business on the basis of price tag. 2) 3) 4)
W. Edwards Deming’s 14 Points 5) Find problems. It is management’s job to work continually on the system. Institute modern methods of training on the job. Institute modern methods of supervision of production workers. The responsibility of foremen must be changed from numbers to quality. Drive out fear that everyone may work effectively for the company. 6) 7) 8)
W. Edwards Deming’s 14 Points 9) Break down barriers between departments. Eliminate numerical goals, posters and slogans for the workforce asking for new levels of productivity without providing methods. Eliminate work standards that prescribe numerical quotas. Remove barriers that stand between the hourly worker and his right to pride of workmanship. 10) 11) 12)
W. Edwards Deming’s 14 Points 13) Institute a vigorous programme of education and retraining. Create a structure in top management that will push everyday on the above 13 points. 14)
Joseph M. Juran and the Cost Of Quality 2 types of costs: Unavoidable Costs: preventing defects (inspection, sampling, sorting, QC) Avoidable Costs: defects and product failures (scrapped materials, labour for re-work, complaint processing, losses from unhappy customers “Gold in the Mine”
What is TQM? Concern for employee involvement and development Management by Fact Constant drive for continuous improvement and learning. Organisation response ability Passion to deliver customer value / excellence Result Focus Partnership perspective (internal / external) Actions not just words (implementation) Process Management
IS QUALITY A SOUND INVESTMENT? YearCompanyStock Growth (Oct 94) 1988 Motorola 373.0% 1988 Westinghouse (CNFD) - 49.6% 1989 Xerox (BPS) 75.9% 1990 General Motors 1.6% 1990 Federal Express 10.6% 1990 IBM (IBM Rochester) - 34.9% 1991 Selectron 526.9% 1992 AT&T (UCS) 32.2% 1992 AT&T (TSBU) 32.2% 1992 Texas Instruments (DS&E) 106.8% 1993 Zyta 8.4% 1994 Eastman Chemical 18.5% Total Stock Value £23016 (91.8% growth) Standard & Poor 500 Stock value £15911 (32.6% growth) Source: US Dept. of Commerce Study 1995
Project Quality management Project Quality Management processes include all the activities of the performing organization that determine quality policies, objectives, and responsibilities so that the project will satisfy the needs for which it was undertaken. It implements the quality management system through the policy, procedures, and processes of quality planning, quality assurance, and quality control, with continuous process improvement activities conducted throughout, as appropriate.
Project Quality Management processes Quality Planning – identifying which quality standards are relevant to the project and determining how to satisfy them. Perform Quality Assurance – applying the planned, systematic quality activities to ensure that the project employs all processes needed to meet requirements. 8.3 Perform Quality Control – monitoring specific project results to determine whether they comply with relevant quality standards and identifying ways to eliminate causes of unsatisfactory performance
Project Management and TQM Modern quality management complements project management. For example, both disciplines recognize the importance of: Customer satisfaction. Understanding, evaluating, defining, and managing expectations so that customer requirements are met. This requires a combination of conformance to requirements (the project must produce what it said it would produce) and fitness for use (the product or service must satisfy real needs). Prevention over inspection. The cost of preventing mistakes is generally much less than the cost of correcting them, as revealed by inspection. Management responsibility. Success requires the participation of all members of the team, but it remains the responsibility of management to provide the resources needed to succeed. Continuous improvement. The plan-do-check-act cycle is the basis for quality improvement
Quality Planning: Tools and Techniques Cost-Benefit Analysis: Quality planning must consider cost-benefits tradeoffs. The primary benefit of meeting quality requirements is less rework, which means higher productivity, lower costs, and increased stakeholder satisfaction. Benchmarking involves comparing actual or planned project practices to those of other projects to generate ideas for improvement and to provide a basis by which to measure performance. Design of Experiments (DOE) is a statistical method that helps identify which factors may influence specific variables of a product or process under development or in production. Cost of Quality (COQ) are the total costs incurred by investment in preventing nonconformance to requirements, appraising the product or service for conformance to requirements, and failing to meet requirements (rework).
Additional Quality Planning Tools Other quality planning tools are also often used to help better define the situation and help plan effective quality management activities.
Quality Planning: Outputs Quality Management Plan describes how the project management team will implement the performing organization’s quality policy. The quality management plan provides input to the overall project management plan and must address quality control (QC), quality assurance (QA),and continuous process improvement for the project. Quality Metrics A metric is an operational definition that describes, in very specific terms, what something is and how the quality control process measures it. A measurement is an actual value. Quality Checklists A checklist is a structured tool, usually component-specific, used to verify that a set of required steps has been performed. Checklists may be simple or complex. Quality Baseline The quality baseline records the quality objectives of the project. Project Management Plan (Updates) The project management plan will be updated through the inclusion of a subsidiary quality management plan
Perform Quality Assurance Quality assurance (QA) is the application of planned, systematic quality activities to ensure that the project will employ all processes needed to meet requirements. Continuous process improvement provides an iterative means for improving the quality of all processes. Continuous process improvement reduces waste and non-value-added activities, which allows processes to operate at increased levels of efficiency and effectiveness.
Perform Quality Assurance: Inputs, Tools & Techniques, and Outputs
Perform Quality Assurance: Tools and Techniques • Quality Planning Tools and Techniques • The quality planning tools and technique. • Quality Audits • A quality audit is a structured, independent review to determine whether project activities comply with organizational and project policies, processes, and procedures. • The objective of a quality audit is to identify inefficient and ineffective policies, processes, and procedures in use on the project. • Quality audits may be scheduled or at random, and may be carried out by properly trained in-house auditors or by third parties, external to the performing organization.
Process Analysis • Process analysis follows the steps outlined in the process improvement plan to identify needed improvements from an organizational and technical standpoint.
Perform Quality Assurance: Outputs • Requested Changes • Quality improvement includes taking action to increase the effectiveness and efficiency of the policies, processes, and procedures of the performing organization, which should provide added benefits to the stakeholders of all projects. • Recommended Corrective Actions • Quality improvement includes recommending actions to increase the effectiveness and efficiency of the performing organization. • Organizational Process Assets (Updates) • Updated quality standards provide validation of the effectiveness and efficiency of the performing organization’s quality standards and processes to meet requirements. • Project Management Plan (Updates)
Perform Quality Control Performing quality control (QC) involves monitoring specific project results to determine whether they comply with relevant quality standards and identifying ways to eliminate causes of unsatisfactory results. Quality standards include project processes and product goals. QC is often performed by a quality control department or similarly titled organizational unit. The project management team should have a working knowledge of statistical quality control, especially sampling and probability, to help evaluate QC outputs.
Among other subjects, the team may find it useful to know the differences between the following pairs of terms: Prevention (keeping errors out of the process) and inspection (keeping errors out of the hands of the customer). Attribute sampling (the result conforms, or it does not) and variables sampling (the result is rated on a continuous scale that measures the degree of conformity). Special causes (unusual events) and common causes (normal process variation). Common causes are also called random causes. Tolerances (the result is acceptable if it falls within the range specified by the tolerance) and control limits (the process is in control if the result falls within the control limits).
Perform Quality Control: Inputs, Tools & Techniques, and Outputs
Perform Quality Control: Tools and Techniques • Cause and Effect Diagram • Cause and effect diagrams, also called Ishikawa diagrams or fishbone diagrams, illustrate how various factors might be linked to potential problems or effects.
Control Charts • A control chart's purpose is to determine whether or not a process is stable or has predictable performance. • Control charts may serve as a data gathering tool to show when a process is subject to special cause variation, which creates an out-of-control condition. • Control charts also illustrate how a process behaves over time • When a process is outside acceptable limits, the process should be adjusted. • The upper control limit and lower control limit are usually set at +/- 3 sigma (i.e., standard deviation). • Control charts can be used for both project and product life cycle processes. An example of project use of control charts is determining whether cost variances or schedule variances are outside of acceptable limits (for example, +/- 10 percent).
Flowcharting Flowcharting helps to analyze how problems occur. A flowchart is a graphical representation of a process. There are many styles, but all process flowcharts show activities, decision points, and the order of processing. Flowcharts show how various elements of a system interrelate. What and where quality problems might occur and, thus, can help develop approaches for dealing with them.
Histogram A histogram is a bar chart showing a distribution of variables. Each column represents an attribute or characteristic of a problem/situation. The height of each column represents the relative frequency of the characteristic. This tool helps identify the cause of problems in a process by the shape and width of the distribution.
Run Chart A run chart shows the history and pattern of variation. A run chart is a line graph that shows data points plotted in the order in which they occur. Run charts show trends in a process over time, variation over time, or declines or improvements in a process over time. Trend analysis is performed using run charts. Trend analysis involves using mathematical techniques to forecast future outcomes based on historical results. Trend analysis is often used to monitor: Technical performance. How many errors or defects have been identified, how many remain uncorrected? •ost and schedule performance. How many activities per period were completed with significant variances?
Scatter Diagram • A scatter diagram shows the pattern of relationship between two variables. • This tool allows the quality team to study and identify the possible relationship between changes observed in two variables. Dependent variables versus independent variables are plotted. • The closer the points are to a diagonal line, the more closely they are related. • Statistical Sampling • Statistical sampling involves choosing part of a population of interest for inspection (for example, selecting ten engineering drawings at random from a list of seventy five). • Appropriate sampling can often reduce the cost of quality control. There is a substantial body of knowledge on statistical sampling; in some application areas, it may be necessary for the project management team to be familiar with a variety of sampling techniques.
Inspection An inspection is the examination of a work product to determine whether it conforms to standards. Generally, the results of an inspection include measurements. Inspections can be conducted at any level. For example, the results of a single activity can be inspected, or the final product of the project can be inspected. Inspections are also called reviews, peer reviews, audits, and walkthroughs. In some application areas, these terms have narrow and specific meanings. Inspections are also used to validate defect repairs.