Download
1 / 35
400 likes | 795 Views
Risk and Return: Past and Prologue. 5. Bodie, Kane and Marcus Essentials of Investments 9 th Global Edition. 5.1 Rates of Return. Holding-Period Return (HPR) Rate of return over given investment period HPR= [PS − PB + CF] / PB PS = Sale price PB = Buy price

E N D
Risk and Return: Past and Prologue 5 Bodie, Kane and Marcus Essentials of Investments 9th Global Edition
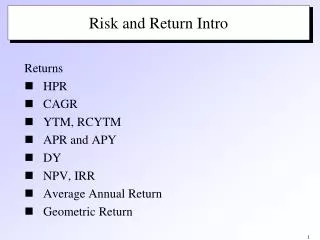
5.1 Rates of Return • Holding-Period Return (HPR) • Rate of return over given investment period • HPR= [PS − PB + CF] / PB • PS = Sale price • PB = Buy price • CF = Cash flow during holding period
Table 5.1 Quarterly Cash Flows/Rates of Return of a Mutual Fund
5.1 Rates of Return • Measuring Investment Returns over Multiple Periods • Arithmetic average • Sum of returns in each period divided by number of periods • Geometric average • Single per-period return; gives same cumulative performance as sequence of actual returns • Compound period-by-period returns; find per-period rate that compounds to same final value • Dollar-weighted average return • Internal rate of return on investment
5.1 Rates of Return APR n • Conventions for Annualizing Rates of Return • APR = Per-period rate × Periods per year • 1 + EAR = (1 + Rate per period) • 1 + EAR = (1 + Rate per period)n= (1 + )n • APR = [(1 + EAR)1/n– 1]n • Continuous compounding: 1 + EAR = eAPR
5.2 Risk and Risk Premiums • Scenario Analysis and Probability Distributions • Scenario analysis: Possible economic scenarios; specify likelihood and HPR • Probability distribution: Possible outcomes with probabilities • Expected return: Mean value of distribution of HPR • Variance: Expected value of squared deviation from mean • Standard deviation: Square root of variance
Figure 5.1 Normal Distribution with Mean Return 10% and Standard Deviation 20%
5.2 Risk and Risk Premiums • Normality over Time • When returns over very short time periods are normally distributed, HPRs up to 1 month can be treated as normal • Use continuously compounded rates where normality plays crucial role
5.2 Risk and Risk Premiums • Deviation from Normality and Value at Risk • Kurtosis: Measure of fatness of tails of probability distribution; indicates likelihood of extreme outcomes • Skew: Measure of asymmetry of probability distribution • Using Time Series of Return • Scenario analysis derived from sample history of returns • Variance and standard deviation estimates from timseries of returns:
5.2 Risk and Risk Premiums Suppose you’ve estimated that the fifth-percentile value at risk of a portfolio is –30%. Now you wish to estimate the portfolio’s first-percentile VaR (the value below which lie 1% of the returns). Will the 1% VaR be greater or less than –30%?
5.2 Risk and Risk Premiums • Risk Premiums and Risk Aversion • Risk-free rate: Rate of return that can be earned with certainty • Risk premium: Expected return in excess of that on risk-free securities • Excess return: Rate of return in excess of risk-free rate • Risk aversion: Reluctance to accept risk • Price of risk (A): Ratio of risk premium to variance
5.2 Risk and Risk Premiums • The Sharpe (Reward-to-Volatility) Ratio • Ratio of portfolio risk premium to standard deviation • Mean-Variance Analysis • Ranking portfolios by Sharpe ratios
5.2 Risk and Risk Premiums 11. Consider a risky portfolio. The end-of-year cash flow derived from the portfolio will be either $ 70,000 or $ 195,000, with equal probabilities of .5. The alternative riskless investment in T-bills pays 4%. a. If you require a risk premium of 8%, how much will you be willing to pay for the portfolio? b. Suppose the portfolio can be purchased for the amount you found in (a). What will the expected rate of return on the portfolio be? c. Now suppose you require a risk premium of 11%. What is the price you will be willing to pay now? d. Comparing your answers to (a) and (c), what do you conclude about the relationship between the required risk premium on a portfolio and the price at which the portfolio will sell?
5.3 The Historical Record • World and U.S. Risky Stock and Bond Portfolios • World Large stocks: 24 developed countries, about 6000 stocks • U.S. large stocks: Standard & Poor's 500 largest cap • U.S. small stocks: Smallest 20% on NYSE, NASDAQ, and Amex • World bonds: Same countries as World Large stocks • U.S. Treasury bonds: Barclay's Long-Term Treasury Bond Index
Figure 5.3 Frequency Distribution of annual, Continuously Compounded rates of Return, 1926-2010
Table 5.2 Annual rate-of-return statistics for diversified portfolios for 1926-2010 and three subperiods (%)
5.4 Inflation and Real Rates of Return • Equilibrium Nominal Rate of Interest • Fisher Equation • R = r + E(i) • E(i): Current expected inflation • R: Nominal interest rate • r: Real interest rate
5.4 Inflation and Real Rates of Return • U.S. History of Interest Rates, Inflation, and Real Interest Rates • Since the 1950s, nominal rates have increased roughly in tandem with inflation • 1930s/1940s: Volatile inflation affects real rates of return
Figure 5.5 Interest Rates, Inflation, and Real Interest Rates 1926-2010
5.5 Asset Allocation across Portfolios • Asset Allocation • Portfolio choice among broad investment classes • Complete Portfolio • Entire portfolio, including risky and risk-free assets • Capital Allocation • Choice between risky and risk-free assets John Bogle of Vanguard Says: The most fundamental decision of investing is the allocation of your assets: How much should you own in stock? How much should you own in bonds? How much should you own in cash reserves? . . . That decision [has been shown to account] for an astonishing 94% of the differences in total returns achieved by institutionally managed pension funds. . . . There is no reason to believe that the same relationship does not also hold true for individual investors.
5.5 Asset Allocation across Portfolios • The Risk-Free Asset • Treasury bonds (still affected by inflation) • Price-indexed government bonds • Money market instruments effectively risk-free • Risk of CDs and commercial paper is miniscule compared to most assets
5.5 Asset Allocation Across Portfolios • Portfolio Expected Return and Risk P: portfolio composition y: proportion of investment budget rf: rate of return on risk-free asset rp: actual rate of return E(rp): expected rate of return σp: standard deviation E(rC): return on complete portfolio E(rC) = yE(rp) + (1 − y)rf σC = yσrp+ (1 − y)σrf
5.5 Asset Allocation across Portfolios • Capital Allocation Line (CAL) • Plot of risk-return combinations available by varying allocation between risky and risk-free • Risk Aversion and Capital Allocation • y: Preferred capital allocation
5.5 Asset Allocation across Portfolios 13) Assume that you manage a risky portfolio with an expected rate of return of 12% and a standard deviation of 28% (Weights: Stock A 20%; Stock B 30%; Stock C 50%(. The T-bill rate is 4%. Suppose your client decides to invest in your risky portfolio a proportion (y) of his total investment budget so that his overall portfolio will have an expected rate of return of 11%. What is the proportion, y? What are your client’s investment proportions in your 3 stocks and the T-bill fund? What is the standard deviation of the rate of return on your client’s portfolio?
5.5 Asset Allocation across Portfolios 14) Assume that you manage a risky portfolio with an expected rate of return of 12% and a standard deviation of 28%. The T-bill rate is 4%. Suppose your client prefers to invest in your portfolio a proportion (y) that maximizes the expected return on the overall portfolio subject to the constraint that the overall portfolio’s standard deviation will not exceed 20%. What is the investment proportion, y? What is the expected returns of the overall portfolio?
5.5 Asset Allocation across Portfolios 17) Assume that you manage a risky portfolio with an expected rate of return of 12% and a standard deviation of 28%. There is also a passive fund that mimics the S&P 500 Index with an expected return of 13% and a standard deviation of 25%. The T-bill rate is 7%. Explain to your client the disadvantage of the switch. Show your client the maximum fee you could charge (as a percent of the investment in your fund deducted at the end of the year) that would still leave him at least as well off investing in your fund as in the passive one.
5.5 Asset Allocation across Portfolios You’ve just decided upon your capital allocation for the next year, when you realize that you’ve underestimated both the expected return and the standard deviation of your risky portfolio by 4%. Will you increase, decrease, or leave unchanged your allocation to risk-free T-bills?
5.6 Passive Strategies and the Capital Market Line • Passive Strategy • Investment policy that avoids security analysis • Capital Market Line (CML) • Capital allocation line using market-index portfolio as risky asset
5.6 Passive Strategies and the Capital Market Line • Cost and Benefits of Passive Investing • Passive investing is inexpensive and simple • Expense ratio of active mutual fund averages 1% • Expense ratio of hedge fund averages 1%-2%, plus 10% of returns above risk-free rate • Active management offers potential for higher returns