Download
1 / 85
850 likes | 862 Views
Presentation about 'Environmentally friendly techniques in Textiles'

E N D
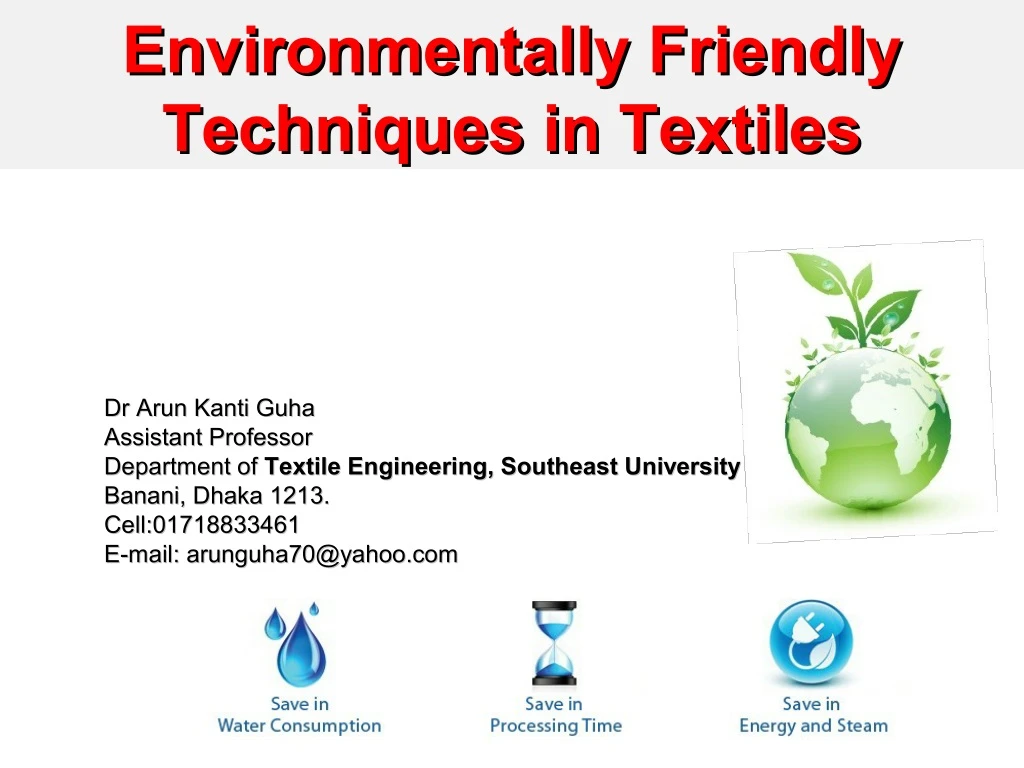
Environmentally Friendly Environmentally Friendly Techniques in Textiles Techniques in Textiles Dr Arun Kanti Guha Dr Arun Kanti Guha Assistant Professor Assistant Professor Department of Department of Textile Engineering, Southeast University Textile Engineering, Southeast University Banani, Dhaka 1213. Banani, Dhaka 1213. Cell:01718833461 Cell:01718833461 E-mail: arunguha70@yahoo.com E-mail: arunguha70@yahoo.com
Prepared By : Prepared By : Mazadul Hasan sheshir ID: 2010000400008 13th Batch (session 2009-2013) Department : Wet Processing Technology Email: mazadulhasan@yahoo.com Blog : www. Textilelab.blogspot.com (visit) Southeast University Department Of Textile Engineering I/A 251,252 Tejgaon Dhaka Bangladesh
Introduction Introduction Presently garments industries have become the backbone of the economy of Bangladesh. To support those garments industries hundreds of full-scale textile industries have emerged in the past few years and a lot more are going to be setup within a short time. These textile dyeing industries are contributing in the development of Bangladesh and at the same time are coursing serious water pollution. It is a matter of great concern to understand and adopt adequate treatment technologies for the remediation of this problem.
Flow Chart of Textile Manufacturing Fiber Production Red Mark:Effluent Spining Weaving Preparation Knitting Yarn Dyeing Weaving Knit Processing Woven Processing Garment Manufacturing Garment Manufacturing Garment Washing & Dyeing Garment Washing & Dyeing
Volume of Effluent produced by the different processing of textiles. Production /Day Effluent Quantity/Day Process Name 1118 m3 Weaving Prreparation 4.14 million meters 16,500 m3 150 tones Yarn Dyeing 1,28,700 m3 1430 tonnes Knit Processing 84,500 m3 Woven Processing 3.84 million meters 8500 m3 500000 pcs Garment Washing & Dyeing ASM Tareq Amin ASM Tareq Amin et al. et al., BTT, , BTT, 2009 2009, , 2 2, 16 , 16
Wastewater Discharged At Wastewater Discharged At Open Areas Open Areas
Wastewater Wastewater Sample Sample
Typical Textile Effluent Characteristics Typical Textile Effluent Characteristics Parameter Parameter Woven Woven Fabric Fabric Finishing Finishing Knit Knit Fabric Fabric Finishing Finishing Stock & Yarn Stock & Yarn Dyeing Dyeing Finishing Finishing Cotton Cotton Textile Mill Textile Mill Woolen Woolen Textile Mill Textile Mill Synthetic Synthetic Textile Mill Textile Mill BOD BOD (mg/L) (mg/L) 550-650 550-650 250-350 250-350 200-250 200-250 760 760 900 900 50 50 COD COD (mg/L) (mg/L) 850-1200 850-1200 850-1000 850-1000 524-800 524-800 1418 1418 - - 500 500 SS SS 185-300 185-300 300 300 50-75 50-75 - - 100 100 - - (mg/L) (mg/L) pH pH 7-11 7-11 6-9 6-9 7-12 7-12 9.8-11.8 9.8-11.8 9-10.5 9-10.5 7.5 7.5 MA Rahman, MS Thesis (BUET), 1997 MA Rahman, MS Thesis (BUET), 1997
Textile Effluent Characteristics: Bangladesh Perspective Textile Effluent Characteristics: Bangladesh Perspective Param Param eter eter m m Value Value Minimu Minimu Maximu Maximu m m Value Value BOD BOD (mg/L) (mg/L) - - 8100 8100 COD COD (mg/L) (mg/L) 16.7 16.7 17100 17100 SS SS 5126 5126 15221 15221 (mg/L) (mg/L) pH pH 3.9 3.9 11.0 11.0 MA Rahman, MS Thesis (BUET), 1997 MA Rahman, MS Thesis (BUET), 1997
Discharge Quality Standards (By DoE) Discharge Quality Standards (By DoE) Parameter Parameter Inland Surface Inland Surface Water Water BOD BOD5 5 C, mg/L) 50 50 (20 (20o oC, mg/L) COD COD (mg/L) (mg/L) 200 200 TDS TDS (mg/L) (mg/L) 2100 2100 Oil & Grease Oil & Grease (mg/L) (mg/L) 10 10 pH pH 6-9 6-9
Typical BOD Loads from Wet Processing 70 Singeing Desizing Scouring Bleaching Mercerizing Heat Setting 60 50 40 . . 30 20 10 0
Textile Waste Water Characterization: At Textile Waste Water Characterization: At City City University University Lab (2009): Area Based Lab (2009): Area Based Textile Waste Water Analysis Textile Waste Water Analysis Ashulia: pH 7.2, TDS (mg/L): 498 mg/L Ashulia: pH 7.2, TDS (mg/L): 498 mg/L Chittagong: pH 11.1, TDS (mg/L):1483 Chittagong: pH 11.1, TDS (mg/L):1483 Dhamrai: pH 6.9, TDS (mg/L): 538 Dhamrai: pH 6.9, TDS (mg/L): 538 mg/L mg/L Gazipur: pH 9.8, TDS (mg/L): 3304 Gazipur: pH 9.8, TDS (mg/L): 3304 Narsindi: pH 14, TDS (mg/L):3109 mg/L Narsindi: pH 14, TDS (mg/L):3109 mg/L Narayangong: pH 10.3, TDS Narayangong: pH 10.3, TDS (mg/L):3260 (mg/L):3260 Savar: pH 10.7, TDS (mg/L):3226 Savar: pH 10.7, TDS (mg/L):3226 1. 1. 2. 2. 3. 3. 4. 4. 5. 5. 6. 6. 7. 7.
Green values are environmentally freidnly Limit: pH 6-9 Narshindi 14 14 Chittagong 11.1 Savar 10.7 12 Narayangong 10.3 Gazipur 9.8 10 Ashulia 7.2 pH Dhamrai 6.9 8 6 4 2 0 Ashulia Chittagong Dhamrai Gazipur Narshindi Narayangong Savar Area
Gazipur 3304 TDS (mg/L) Nrayangong 3260 3500 Savar 3226 Narshindi 3109 3000 2500 Green values are environmentally friendly Limit: TDS 21OO mg/L 2000 Chittagong 1483 1500 1000 Ashulia 498 Dhamrai 538 500 0 Ashulia Chittagong Dhamrai Gazipur Narshindi Narayangong Savar Area
Environmental Environmental Management Methods in Management Methods in Textiles Textiles 1. Good House Keeping, 10-15% 2. Closer Process Control: 30-40% 2. Closer Process Control: 30-40% Reduction in Chemical usage Reduction in Chemical usage Recovery & Reuse of Chemicals Recovery & Reuse of Chemicals Process Modification: Low liquor ratio Process Modification: Low liquor ratio machines machines Technological Development: Technological Development: Supercritical CO Supercritical CO2 2 fluid dyeing fluid dyeing 3. Process Chemicals Substitution 3. Process Chemicals Substitution PVA/CMC Use PVA/CMC Use 4. ETPs 4. ETPs 1. Good House Keeping, 10-15%
Types of Effluent Types of Effluent Treatment Plants Treatment Plants Physicochemical Physicochemical 1. 1. Biological Biological 2. 2. Biochemical (Hybrid) Biochemical (Hybrid) 3. 3. Electrochemical Electrochemical 4. 4. Chlorine Chlorine 5. 5.
ETP Diagram ETP Diagram
Physicochemical Effluent Physicochemical Effluent Treatment Plants Treatment Plants Screening Screening Equalization Equalization pH Control (HCl/H pH Control (HCl/H2 2SO Coagulation and Flocculation Coagulation and Flocculation (CaO, FeSO (CaO, FeSO4 4 /Alumn and /Alumn and Polyelectrolyte) Polyelectrolyte) SO4 4) ) Retention Time, Equalization: Retention Time, Equalization: for 40 m for 40 m3 3/hr, 8h /hr, 8h
Flocculation and Coagulation in Flocculation and Coagulation in Physicochemical Effluent Physicochemical Effluent Treatment Plants Treatment Plants Coagulation of negative particles with positive aluminum-complex Flocculation by entanglement with charge-bearing polymers
Different Types of Different Types of Biological Biological Treatment Plants Treatment Plants Dispersed Growth: Dispersed Growth: Activated sludge Activated sludge (Retention time 48 h) (Retention time 48 h) Membrane Bio-Reactor Membrane Bio-Reactor Oxidation ditches/ponds Oxidation ditches/ponds Aerated lagoons, stabilization Aerated lagoons, stabilization ponds ponds Fixed Growth: Fixed Growth: Trickling filters Trickling filters Rotating Biological Contactors Rotating Biological Contactors (RBCs (RBCs) )
Typical Reactions in Biological Typical Reactions in Biological Processes Processes Organic waste is introduced into a reactor where the bacterial culture performs the conversion of organic matter to CO2, H2O, NH3 and others. Oxidation : Oxidation : COHNS + O COHNS + O2 2 + nutrients bacteria + nutrients CO CO2 2 + H + Other end products + Other end products + H2 2O O
Activated Sludge Activated Sludge Process Process Process in which a mixture of Process in which a mixture of wastewater and microorganisms wastewater and microorganisms is agitated and aerated is agitated and aerated Leads to oxidation of dissolved Leads to oxidation of dissolved organics organics After oxidation, separate sludge After oxidation, separate sludge from wastewater from wastewater Induce microbial growth Induce microbial growth
Activated Sludge Process Activated Sludge Process Return Activated Sludge (RAS) w/w Mixed Mixed Liquor Liquor in in Reactor Reactor Air Treated w/w Secondary Secondary Clarifier Clarifier Discharge to River or Land Application Waste Activated Sludge (WAS)
Activated Sludge Activated Sludge Process Process
ETP Flow Chart of Irish Fabrics Influent Screening Storage Tank Floculation & Coagulation Equalisation Tank Secondary Clarifier Reactor pH Control Tank Sludge Recycling Effluent Discharge
Membrane Bio-Reactor (MBR) Membrane Bio-Reactor (MBR) The membrane bioreactor (MBR) process that uses both a biological stage and a membrane module has recently been developed for wastewater treatment. The bioreactor and membrane module each have a specific function: 1. Biological degradation of organic pollution is carried out in the bioreactor by adapted microorganisms; 2. Separation of microorganisms from the treated wastewater is performed by the membrane module. The membranes constitute a physical barrier for all suspended solids and therefore enable not only recycling of the activated sludge to the bioreactor but also production of a permeate, free of suspended matter, bacteria, and viruses.
Proces Basic Proces Basic sludge floc water dissolved solids membrane Suction bacteria viruses
MBR Types MBR Types In terms of settling tank In terms of settling tank replacement replacement There are two types of configurations for the membrane array There are two types of configurations for the membrane array Industrial effluent Membrane Module Permeate Aeration Sludge Discharge The membranes can be placed either outside or inside the bioreactor The membranes can be placed either outside or inside the bioreactor
MBR Establishments in MBR Establishments in Bangladesh Bangladesh At SUST Sylhet At Jago Corporation Ashulia At EOS Savar
Process Flow chart of Process Flow chart of MBR: MBR: Effluent from Dyeing house Equalization Tank Gravity Feeder Multi chambered Reactor Zero Sludge Discharge of Treated Water
Figure: Hollow fiber membrane Figure: Hollow fiber membrane
Hollow fibre membrane module Hollow fibre membrane module
Figure: Cassette of Hollow Fiber Membranes Figure: Cassette of Hollow Fiber Membranes
Fig: Full view of MBR in Uni-house yarn dyeing factory. Fig: Full view of MBR in Uni-house yarn dyeing factory.
Achievement of zero sludge discharge: In residual part i.e. sludge, new bacteria acts In residual part i.e. sludge, new bacteria acts here activated sludge. At the bottom part of the here activated sludge. At the bottom part of the reactor there is a sludge returning pump. This reactor there is a sludge returning pump. This pump is regulated by a centrifugal pump. When pump is regulated by a centrifugal pump. When this activated sludge passing through this this activated sludge passing through this pump, due to the high rpm of the motor, pump, due to the high rpm of the motor, activated (alive) bacteria becomes de-activated activated (alive) bacteria becomes de-activated (dead). These dead bacteria become the (dead). These dead bacteria become the nutrient of the activated bacteria again. This nutrient of the activated bacteria again. This process continues again & again & thus we can process continues again & again & thus we can get zero sludge discharge. get zero sludge discharge. Achievement of zero sludge discharge:
Raw Wastewater …… …… Air Treated Water Sludge Stress Treatment Pump Bottom Sludge
Membrane Bio-Reactor vs. Conventional Membrane Bio-Reactor vs. Conventional Biological Unit Biological Unit Conventional Multi-Step Tertiary Process Low Quality Turbid Water Membrane Bio-Reactors Smaller Footprint & More Compactness Fast Adaptability for changes in Flow rate, COD/BOD ratio and imposed COD Water Reuse and Recycling Less Sludge Production Less or no chemical use and provides highest quality water No formation of secondary chemical by-products Easy Scale-up, Expansion and Modification Absolute barrier for Bacteria and Viruses Ease of integration into existing plants for upgrade applications
Low-Tech Solutions Low-Tech Solutions Aerobic ponds Aerobic ponds Facultative ponds Facultative ponds Anaerobic ponds Anaerobic ponds Aerobic ponds Facultative ponds Anaerobic ponds
Chemicals Required for 60 m3/hr (Hybrid) Chemicals Chemicals Quantity/day Quantity/day Acid Acid 135 L 135 L FeSO FeSO4 4 Lime Lime Anionic PE Anionic PE DAP DAP Urea Urea Bacteria 2ookg for 3-5 years 2580 kg 2580 kg 1740 kg 1740 kg 2.16 kg 2.16 kg 9.0 kg 9.0 kg 18 kg 18 kg Bacteria 2ookg for 3-5 years
ETP Design & ETP Design & optimization optimization Computer-Aided Design & Optimization of Computer-Aided Design & Optimization of Effluent Treatment Plant (ETP) Effluent Treatment Plant (ETP) Developed by the Harbinger Team Developed by the Harbinger Team of Engineers of Engineers © Center for Environmental Process © Center for Environmental Process Engineering Engineering Shahjalal University of Science & Shahjalal University of Science & Technology Technology
Introducing ETP-CAD Introducing ETP-CAD
Purposes to Design the Purposes to Design the Software Software To enhance the followings To enhance the followings Design Design Optimization Optimization Performance Analysis Performance Analysis Visualization Visualization Taking Decision Taking Decision to increase efficiency and to increase efficiency and accuracy accuracy Language Used: MATLAB Language Used: MATLAB and C and C
The Team The Team
Jar Test Data Analysis Jar Test Data Analysis Jar Test Data Analysis Jar Test Data Analysis
Aeration Tank Aeration Tank
ETP ETP Dr Arun Kanti Guha Dr Arun Kanti Guha Assistant Professor Assistant Professor Department of Department of City Banani, Dhaka 1213. Banani, Dhaka 1213. City University University
Re Use Re Use Wastewater Reuse in Agriculture
Wastewater Reuse in Wastewater Reuse in Gardening Gardening