Download
1 / 31
320 likes | 573 Views
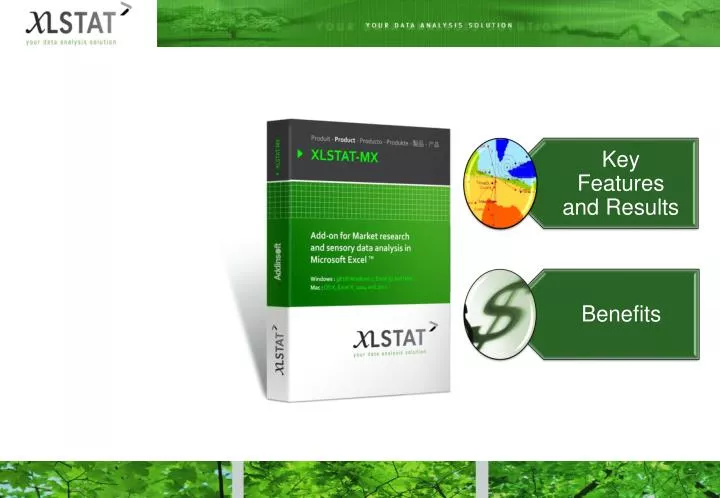
Key Features and Results. Benefits. XLSTAT-MX functions. Preference Mapping (PREFMAP). Build decision making maps to: • Improve or develop products • Position products in comparison with competitors’ products • Reach a target market

E N D
Key Features and Results Benefits
Preference Mapping (PREFMAP) • Build decision making maps to: • Improve or develop products • Position products in comparison with competitors’ products• Reach a target market • Preference mapping =a powerful tool to optimize product acceptability. • XLSTAT-MX offers several regression models to project complementary data on the objects maps: • Vector model,• Circular ideal point model,• Elliptical ideal point model,• Quadratic ideal point model.
Preference Mapping (PREFMAP) • 10 commercial samples of potato chips • 99 consumers satisfaction from 1 to 30 • Consumers are segmented into 9 clusters
Generalized Procrustes Analysis (GPA) • GPA is pretreatment used to reduce the scale effects and to obtain a consensual configuration.
Generalized Procrustes Analysis (GPA) • GPA compares the proximity between the terms that are used by different experts to describe products.
Multiple Factor Analysis (MFA) • MFA is a generalization of PCA (Principal Component Analysis) and MCA (Multiple Correspondence Analysis). • MFA makes it possible to: • Analyze several tables of variables simultaneously, • Obtain results that allow studying the relationship between the observations, the variables and tables.
Multiple Factor Analysis (MFA) • 36 experts have graded 21 wines analysed on several criteria: • Olfactory (5 variables) • Visual (3 variables) • Taste (9 variables) • Quality (2 variables)
Multiple Factor Analysis (MFA) • MFA groups the information on one chart
Multiple Factor Analysis (MFA) • MFA groups the information on one chart
Multiple Factor Analysis (MFA) • Wine 13 is in the direction of the two quality variables and is therefore the wine of preference.
Multiple Factor Analysis (MFA) • The olfactory criteria are often increasing the distance between the wines.
Penalty analysis • Identify potential directions for the improvement of products, on the basis of surveys performed on consumers or experts. • Two types of data are used: • Preference data (or liking scores) for a product or for a characteristic of a product • Data collected on a JAR (Just About Right) scale
Penalty analysis • A type of potato chips is evaluated: • By 150 consumers • On a JAR scale (1 to 5) for 4 attributes: • Saltiness, • Sweetness, • Acidity, • Crunchiness. • And on an overall liking (1 to 10) score scale
Penalty analysis Mean of Liking for JAR – Mean of Liking for too little and too much
Semantic differential charts • The semantic differential method is a visualization method to plot the differences between individuals' connotations for a given word. • This method can be used for: • Analyzing experts’ agreement on the perceptions of a product described by a series of criteria on similar scales • Analyzing customer satisfaction surveys and segmentation • Profiling products
Semantic differential charts • 1 yoghurt • 5 experts • 6 attributes: • Color • Fruitiness • Sweetness • Unctuousness • Taste • Smell
TURF analysis • TURF = Total Unduplicated Reach and Frequency method • Highlight a line of products from a complete range of products in order to have the highest market share. • XLSTAT offers three algorithms to find the best combination of products
TURF analysis • 27 possible dishes • 185 customers • "Would you buy this product?" (1: No, not at all to 5: Yes, quite sure). • The goal is to obtain a product line of 5 dishes maximizing the reach
Product characterization • Find which descriptors are discriminating well a set of productsand which the most important characteristics of each product are. • Check the influence on the scores of attributes of: • Product • Judge • Session • Judge*Product • All computations are based on the analysis of variance (ANOVA) model.
Product characterization • 29 assessors • 6 chocolate drinks • 14 characteristics: • Cocoa and milk taste and flavor • Other flavors: Vanilla, Caramel • Tastes: bitterness, astringency, acidity, sweetness • Texture: granular, crunchy, sticky, melting
DOE for sensory data analysis • Designing an experiment is a fundamental step to ensure that the collected data will be statistically usable in the best possible way.
DOE for sensory data analysis • Prepare a sensory evaluation where judges (experts and/or consumers) evaluate a set of products taking into account: • Number of judges to involve • Maximum number of products that a judge can evaluate during each session • Which products will be evaluated by each of the consumers in each session, and in what order (carry-over) • Complete plans or incomplete block designs, balanced or not. • Search optimal designs with A- or D-efficiency
DOE for sensory data analysis • 60 judges • 8 products • Saturation: 3 products / judge
Let XLSTAT-MX be part of yourproductdevelopmentstrategy. info@xlstat.com