Download
1 / 31
310 likes | 321 Views
Direct Variation. Warm-Up. Course 3. Insert Lesson Title Here. Warm-Up Day 2. Course 3. Insert Lesson Title Here. Direct Variation. 12-5. Course 3. Insert Lesson Title Here. Vocabulary. Direct Variation. 12-5. Helpful Hint.

E N D
Warm-Up Course 3 Insert Lesson Title Here
Warm-Up Day 2 Course 3 Insert Lesson Title Here
Direct Variation 12-5 Course 3 Insert Lesson Title Here Vocabulary
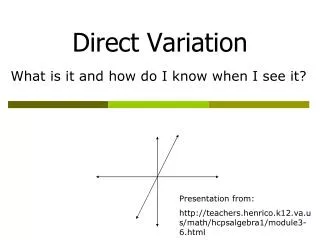
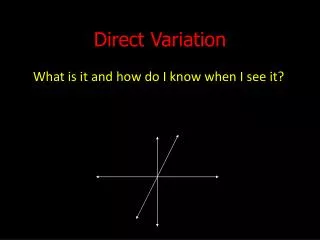
Direct Variation 12-5 Helpful Hint • The graph of a direct-variation equation is always linear (straight line) • The graph of direct-variation equation always contains the origin (0, 0). • The variables x and y either increase together or decrease together. Course 3 Origin
Direct Variation 12-5 Helpful Hint Course 3 Direct Variation - When the ratios are proportional the relationship is a direct variation.
Direct Variation 12-5 Course 3 Determine whether the data set shows direct variation. X Y • QUESTIONS: • Do x and yboth increase or decrease? • Are the ratios proportional? • Is the graph a straight line? • Does the line pass through the origin?
Direct Variation 12-5 Course 3 Additional Example 1B Continued Make a graph that shows the relationship between the number of minutes and the distance the train travels. Plot the points. The points lie in a straight line. (0, 0) is included.
Direct Variation 12-5 25 10 50 20 Course 3 Additional Example 1B Continued You can also compare ratios to see if a direct variation occurs. Compare ratios. = When the ratios are proportional. The relationship is a direct variation.
Direct Variation 12-5 Course 3 Determine whether the data set shows direct variation. X y • QUESTIONS: • Do x and yboth increase or decrease? • Are the ratios proportional? • Is the graph a straight line? • Does the line pass through the origin?
Direct Variation 12-5 Course 3 Check It Out: Example 1A Continued Make a graph that shows the relationship between number of baskets and distance. The graph is not linear. 5 4 3 Number of Baskets 2 1 20 30 40 Distance (ft)
Direct Variation 12-5 3 5 30 20 ? = Course 3 Check It Out: Example 1A Continued You can also compare ratios to see if a direct variation occurs. 60 150 60. The ratios are not proportional. 150 The relationship of the data is not a direct variation.
Direct Variation 12-5 Course 3 Determine whether the data set shows direct variation.
Direct Variation 12-5 Course 3 X y • QUESTIONS: • Do x and yboth increase or decrease? • Are the ratios proportional? • Is the graph a straight line? • Does the line pass through the origin?
Direct Variation 12-5 Course 3 X y
Direct Variation 12-5 Course 3 Determine whether the data set shows direct variation. • QUESTIONS: • Do x and yboth increase or decrease? • Are the ratios proportional? • Is the graph a straight line? • Does the line pass through the origin?
Direct Variation 12-5 4 3 Number of Cups 2 1 32 8 16 24 Number of Ounces Course 3 Check It Out: Example 1B Continued Make a graph that shows the relationship between ounces and cups. Plot the points. The points lie in a straight line. (0, 0) is included.
Direct Variation 12-5 1 = = = 8 3 4 2 24 32 16 Course 3 Check It Out: Example 1B Continued You can also compare ratios to see if a direct variation occurs. Compare ratios. The ratios are proportional. The relationship is a direct variation.
Direct Variation 12-5 Course 3 Determine whether the graph shows direct variation.
Direct Variation 12-5 Course 3 Determine whether the graph shows direct variation.
Direct Variation 12-5 Course 3 Determine whether the graph shows direct variation.
Direct Variation 12-5 Course 3 Determine whether the data set shows direct variation.
Direct Variation 12-5 Course 3 Determine whether the data set shows direct variation.
Direct Variation 12-5 Course 3 Ticket Out the Door What are the four questions you should ask when determining whether there is a direct variation?
Direct Variation 12-5 Course 3 Insert Lesson Title Here Vocabulary
Direct Variation 12-5 Course 3 Check It Out: Example 2A Y varies directly with X. Solve and write an equation when x is 4 when y is 24 y = kx y varies directly with x. 24 = k4 Substitute for x and y. 6 = k Solve for k. Substitute 6 for k in the original equation. y = 6x
Direct Variation 12-5 = k Course 3 Check It Out: Example 2B Y varies directly with X. Solve and write an equation when x is 14 when y is 28 y = kx y varies directly with x. 28 = k14 Substitute for x and y. Solve for k. Rewrite equation.
Direct Variation 12-5 Course 3 Additional Example 2A: Finding Equations of Direct Variation Find each equation of direct variation, given that y varies directly with x. y is 54 when x is 6 y = kx y varies directly with x. 54 = k6 Substitute for x and y. 9 = k Solve for k. Substitute 9 for k in the original equation. y = 9x
Direct Variation 12-5 = k y = x Substitute for k in the original equation. 5 5 5 4 4 4 Course 3 Y varies directly with X. Solve when x is 12 when y is 15 y = kx y varies directly with x. 15 = k12 Substitute for x and y. Solve for k.
Direct Variation 12-5 Course 3 Insert Lesson Title Here Lesson Quiz: Part II 4. The table shows the amount of money Bob makes for different amounts of time he works. Determine whether there is a direct variation between the two sets of data. If so, find the equation of direct variation. direct variation; y = 12x