Download
1 / 12
130 likes | 366 Views
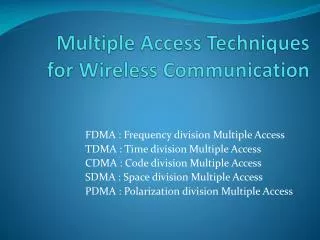
Chapter 3. Wireless Systems: Multiple Access Technologies & Standards. FDMA. Power. Frequency. Time. TDMA. Power. Frequency. Time. CDMA. Power. Frequency. Time. Multiple Access Technologies. FDMA (example: AMPS) Frequency Division Multiple Access

E N D
Chapter 3 Wireless Systems: Multiple Access Technologies & Standards RF100 (c) 1998 Scott Baxter
FDMA Power Frequency Time TDMA Power Frequency Time CDMA Power Frequency Time Multiple Access Technologies • FDMA (example: AMPS) Frequency Division Multiple Access • each user has a private frequency (at least in their own neighborhood) • TDMA (examples: IS-54/136, GSM) Time Division Multiple Access • each user has a private time on a private frequency (at least in their own neighborhood) • CDMA (examples: IS-95, J-Std. 008) Code Division Multiple Access • users co-mingle in time and frequency but each user has a private code (at least in their own neighborhood) RF100 (c) 1998 Scott Baxter
AMPS-TDMA-GSM 1 1 4 7 2 6 7 3 5 6 1 4 5 1 2 4 1 7 2 3 6 3 5 1 1 Conventional Technologies:Recovering the Signal / Avoiding Interference • In ordinary radio technologies, the desired signal must be stronger than all interference by at least a certain margin called C/I (carrier-to-interference ratio) • the type of signal modulation determines the amount of interference which can be tolerated, and thus the required C/I • In conventional systems, the C/I is controlled mainly by the distance between co-channel cells • frequency usage is planned so that co-channel users don’t have interference worse than C/I • any undesired interference we face is coming from the nearest co-channel cells, far away • if the signal is delicate, then we need a big C/I and the co-channel cells must be very far away • if the signal is more rugged, we can tolerate more interference (smaller C/I) allowing the co-channel cells a bit closer without bad effects Figure of Merit: C/I (carrier/interference ratio) AMPS: +17 dB TDMA: +14 to 17 dB GSM: +7 to 9 dB. RF100 (c) 1998 Scott Baxter
B D A C Tech-nology Modulation Type Channel Bandwidth Quality Indicator D C B A Sites AMPS Analog FM 30 kHz. C/I @ 17 dB NAMPS Analog FM 10 kHz. C/I @ 17 dB TDMA DPQSK 30 kHz. C/I @ 17 dB -50 GSM GMSK 200 kHz. C/I @ 7-9 dB RSSI, dBm CDMA QPSK/OQPSK 1,250 kHz. Eb/No @ 6dB C/I -120 Handoffs and C/I • One purpose of handoff is to keep the call from dropping as the mobile moves out of range of individual cells • Another purpose of handoff is to ensure the mobile is using the cell with the best signal strength and best C/I at all times • Notice in the signal graphs at lower right how the mobile’s C/I is maintained at a usable level as it goes from cell to cell RF100 (c) 1998 Scott Baxter
CDMA CDMA: Using A New Dimension • All CDMA users occupy the same frequency at the same time! Frequency and time are not used as discriminators • CDMA operates by using a new dimension, CODING, to discriminate between users • In CDMA, we do not try to immediately recover the pulses of energy from each user. Instead, we watch long groups of the totals of everybody’s pulses, and detect little patterns which are the “signature” of the user we wish to decode • In CDMA, the interference originates mainly from nearby users in the same general area • Each user is a small voice in a roaring crowd -- but with a uniquely recoverable code Figure of Merit: C/I AMPS: +17 dB TDMA: +14 to +17 dB GSM: +7 to 9 dB. CDMA: -10 to -17 dB. Although the CDMA C/I is negative, the decoding process recovers the user’s energy while discarding others’ energy. The final net result is Eb/No, typically about +6 db. We’ll study this in detail later. RF100 (c) 1998 Scott Baxter
Technology StandardsDocuments FirstUsed Modul-ation ServiceTypes Band-width Users/Carrier AMPSAdvanced Mobile Phone Service EIA/TIA 553IS-19 mobileIS-20 base sta. 1983 AnalogFM17 dB C/I Voice 30 kHz 1 NAMPS Narrowband AMPS IS-88 1990 AnalogFM17 dB C/I VoiceSMS 10 kHz 1 D-AMPS Digital AMPSNorth American TDMA IS-54B 1993 DigitalDQPSK14 dB C/I(fragile) VoiceData 30 kHz 3(6 in future?) IS-136 1995 +CAVE +DCCH +SMS GSM European 2nd-Generation TDMA ETSI/TIA/ITUmultipledocuments 1992 DigitalGMSK6 dB C/I(robust) VoiceSMSCell Bcstfrq hop’g 200 kHz 8(16 in future?) CDMACode Division Multiple Access IS-95A, Joint Std. 008,+ features stds 1995 DigitalQPSKSpreadSpectrum VoiceSMSData+more 1250 kHz 22 8kb17 13kb Wireless Technologies: A SummaryMAJOR TECHNOLOGIES DEPLOYED IN NORTH AMERICA RF100 (c) 1998 Scott Baxter
Summary of Major Global Analog Wireless Technologies AMPS IS-553 NAMPS IS-91 TACS NMT450 NMT900 C-450 Frequency Band 800 800 900 450 900 450 Channel Spacing 30 kHz. 10 kHz. 25 25 12.5 20 Speech Modulation FM FM FM FM FM FM Freq. Deviation 12 kHz. 5 kHz. 9.5 5.0 5.0 4.0 Signaling Modulation Dir.FSK Dir.FSK Dir.FSK Aud.FFSK Aud.FFSK Dir.FSK Signaling Bit Rate 10 kb/s 10 kb/s 8 kb/s 1200 b/s 1200 b/s 5280 b/s Overlay Signaling? no no no no no yes Paging/Access CCH (f) CCH (f) CCH (f) CCH (f) CCH (f) CCH (f) In-Call Supervision SAT DSAT SAT ? ? overlay In-Call Control ST DSAT ST ? ? overlay Call Control ST DSAT ST ? ? overlay Handoff Logic BTSLCR BTSLCR BTSLCR BTSLCR BTSLCR BTSLCR RF100 (c) 1998 Scott Baxter
GSM, DCS1800 PCS1900 D-AMPS IS-54 IS-136 CDMA IS-95 JStd008 Japan PDC CT-2 DECT Access Method TDMA TDMA CDMA TDMA TDMA TDMA Frequency Band(s) 900 1800 1900 800 1900* 800 1900 8/900 1400 865 1880 Channel Spacing 200 30, 50* x 50/25i 100 1728 Modulation type GMSK DQPSK QPSK DQPSK GFSK GFSK Signal Bandwidth 200+ 30 1250+ 50 100 1800 Signaling Modulation GMSK DQPSK QPSK DQPSK GFSK GFSK Transmission, kb/s ~240 ~44 1229ss 42 72 1152 Paging/Access ch. CCH (t) CCH(f) CCH(c) CCH(f) BCH BCH Signaling kb/s ~30 ~44 9.6 x 32 32 Info kb/s 14.4 x 9.6,14.4 11.2 32 32 Info frames/s ~200 50 50 50 packets 100 In-Call signaling TCH, SDCCH TCH, SACCH TCH ACCH SACCH hybrid hybrid Handoff Logic MAHO MAHO+ MDHO ? ? MDHO Summary of Major Global Digital Wireless Technologies RF100 (c) 1998 Scott Baxter
AMPS, D-AMPS, N-AMPS 2 1 3 1 Users 3 7 1 6 4 5 Vulnerability: C/I @ 17 dB 30 30 10 kHz Bandwidth Typical Frequency Reuse N=7 2 Vulnerability: C/I @ 6.5-9 dB 1 8 Users 3 4 200 kHz Typical Frequency Reuse N=4 1 CDMA Vulnerability: EbNo@ 6 dB 1 1 1 1 1 1 1 22 Users 1 1 1 1 1 1 1250 kHz Typical Frequency Reuse N=1 Wireless System Capacity Each wireless technology (AMPS, NAMPS, D-AMPS, GSM, CDMA) uses a specific modulation type with its own unique signal characteristics • Signal Bandwidth determines how many RF signals will “fit” in the operator’s licensed spectrum • Robustness of RF signal determines tolerable level of interference and necessary physical separation of cochannel cells • Number of users per RF signal directly affects capacity • In the following page, we will develop the number of users and traffic in erlangs per site for each of the popular wireless technologies RF100 (c) 1998 Scott Baxter
Comparison of Wireless System Capacities RF100 (c) 1998 Scott Baxter
CDMA Carrier Frequencies 1 2 3 4 5 6 7 8 9 10 11 f Capacity of Multicarrier CDMA Systems RF100 (c) 1998 Scott Baxter
End of Section RF100 (c) 1998 Scott Baxter