Download
1 / 18
180 likes | 282 Views
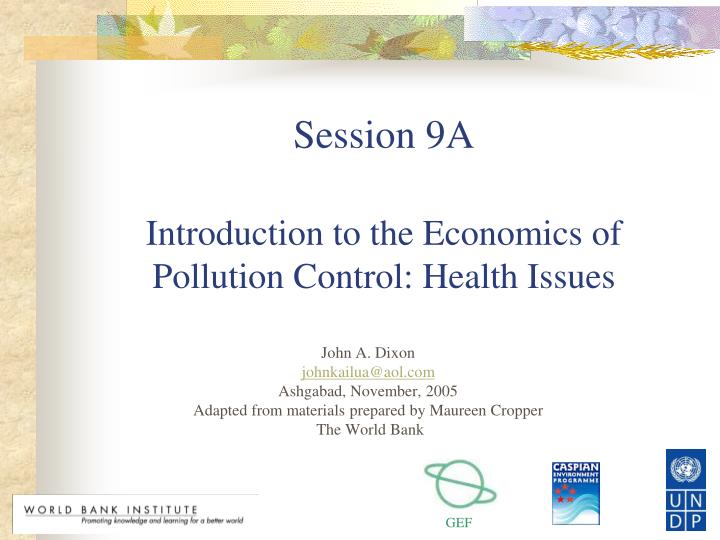
Session 9A Introduction to the Economics of Pollution Control: Health Issues. John A. Dixon johnkailua@aol.com Ashgabad, November, 2005 Adapted from materials prepared by Maureen Cropper The World Bank. What Questions Can Economic Valuation/BCA Help Answer?.

E N D
Session 9AIntroduction to the Economics of Pollution Control: Health Issues John A. Dixon johnkailua@aol.com Ashgabad, November, 2005 Adapted from materials prepared by Maureen Cropper The World Bank
What Questions Can Economic Valuation/BCA Help Answer? • How stringent should environmental standards be for • Air quality? • Surface water quality? • Drinking water quality? • What about POPs? • Any other pollutant? Caspian EVE 2005/UNDP and WBI John A. Dixon, Economics of Pollution Control
Benefits and Costs of Pollution Control • Four categories of benefits could be examined: • Human health (the focus here) • Visibility (amenity values) • Ecological Effects (and ecosystem services) • Agricultural Benefits (change in production) Caspian EVE 2005/UNDP and WBI John A. Dixon, Economics of Pollution Control
Valuing Environmental Health Effects Damage Function Approach • Value of number of cases of illness/death avoided = Number of Cases Avoided * Value per Case • Value per Case Avoided should reflect individual’s willingness to pay (WTP) to avoid illness or risk of death • Human Capital/Cost of Illness Approach, which focuses on lost productivity, medical costs, generally serves as a lower bound to WTP Caspian EVE 2005/UNDP and WBI John A. Dixon, Economics of Pollution Control
The numbers can be large! For example, in 2010 the Monetized Benefits from the US Clean Air Act are estimated as follows: Caspian EVE 2005/UNDP and WBI John A. Dixon, Economics of Pollution Control
Steps in Calculating Health Benefits for Air or Water Quality Improvements • Predict change in emissions of criteria pollutants associated with air/ water quality regulations • Translate changes in emissions into population-weighted changes in ambient exposures • Calculate associated changes in health outcomes • Reduced premature mortality • Reduced hospital admissions • Fewer cases of chronic bronchitis or diarrhea • Assign a dollar value to cases of illness, mortality avoided Caspian EVE 2005/UNDP and WBI John A. Dixon, Economics of Pollution Control
Air Pollution Example: Studies of the Health Impacts • Examine effects of acute air pollution exposure on • Premature death • Hospital admissions for heart, lung disease • Emergency room visits for heart, lung disease • Work-loss days • Examine effects of chronic exposure on • Premature death • Chronic bronchitis Caspian EVE 2005/UNDP and WBI John A. Dixon, Economics of Pollution Control
Interpretation of Dose-Response Function (or DRR) • Dose-response function relates health effects to air pollution concentrations and other factors affecting health • Slope of dose-response function measures the percentage change in the health outcome for a one unit change in PM10 • For example, a 10 microgram reduction in PM10 reduces deaths by about 4% in studies of the impact of long-term exposure to air pollution on deaths Caspian EVE 2005/UNDP and WBI John A. Dixon, Economics of Pollution Control
Projected Reductions in Illness due to the US Clean Air Act, Titles I - V Caspian EVE 2005/UNDP and WBI John A. Dixon, Economics of Pollution Control
Valuing Environmental Health Effects The Damage Function Approach: • Value of number of cases of illness/death avoided = Number of Cases Avoided * Value per Case • Value per Case Avoided should reflect individual’s willingness to pay (WTP) to avoid illness or risk of death • Human Capital/Cost of Illness Approach, which focuses on lost productivity, medical costs, generally serves as a lower bound to WTP Caspian EVE 2005/UNDP and WBI John A. Dixon, Economics of Pollution Control
Valuing Risks to Life: What Is to Be Valued? • Epidemiologic studies predict number of deaths avoided • Treat these as equivalent to reducing risk of death for each person in the exposed population • Risk reduction per person = (Number of deaths avoided)/(Size of exposed population) Caspian EVE 2005/UNDP and WBI John A. Dixon, Economics of Pollution Control
Key Concepts • Concept of a Statistical Life • Reducing risk of death by 1 in 10,000 for each of 10,000 people saves one statistical life • Value of a Statistical Life (VSL) • If each of the 10,000 people is willing to pay $500 for the 1 in 10,000 risk reduction • the Value of a Statistical Life is = 10,000 x $500 = $5,000,000 Caspian EVE 2005/UNDP and WBI John A. Dixon, Economics of Pollution Control
How to Measure WTP for a Reduction in Risk of Death? • Labor Market Studies • Use compensating wage differentials to value risks of death • Contingent Valuation Studies • Ask people directly what they would pay for a change in risk of death • Averting Behavior Studies • Use data on seatbelt use, purchase of smoke detectors, switch to low-tar cigarettes Caspian EVE 2005/UNDP and WBI John A. Dixon, Economics of Pollution Control
Empirical Estimates of Value of a Statistical Life (VSL) in the US • Value of Statistical Life estimates range between $ 1 - 10 million (1990 USD); USEPA’s preferred estimate is $4.8M (1990 USD) • Problems: • Average age of worker is 40—older than average age of person whose life is extended by an environmental program • Estimates of VSL from Averting Behavior Studies almost one order of magnitude lower than in Labor Market Studies Caspian EVE 2005/UNDP and WBI John A. Dixon, Economics of Pollution Control
Valuing Reductions in Morbidity (sickness) • Private WTP for a reduction in risk of illness should reflect: • Value of lost work time • Value of lost leisure time • Value of expenditures to treat illness • Value of expenditures to avoid illness • Discomfort (pain) of illness • Value to Society of the Risk Reduction = Individual’s WTP plus reduction in costs borne by society • Cost of Illness = Value of lost work time + Value of medical expenditures Caspian EVE 2005/UNDP and WBI John A. Dixon, Economics of Pollution Control
Approaches to Valuing Morbidity • Ask directly WTP to avoid illness or risk of illness • Look at rate of substitution of one risk for another (Risk-Risk Tradeoffs) • Use Cost of Illness estimates as a lower bound to WTP Caspian EVE 2005/UNDP and WBI John A. Dixon, Economics of Pollution Control
Health Effects in the US: Valuation per health outcome (1990 $) Caspian EVE 2005/UNDP and WBI John A. Dixon, Economics of Pollution Control
Valuing Morbidity and Mortality in the Caspian region • Persian Gulf Environmental Damages (air pollution from burning oil wells) • VSL calculations from Iran • Other examples • And don’t forget the other types of values: • Amenities • Ecosystem effects • Agricultural/ fisheries production Caspian EVE 2005/UNDP and WBI John A. Dixon, Economics of Pollution Control