Download
1 / 19
190 likes | 195 Views
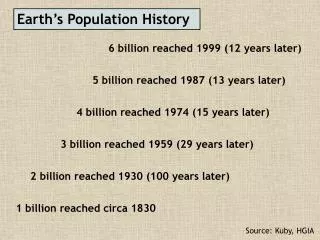
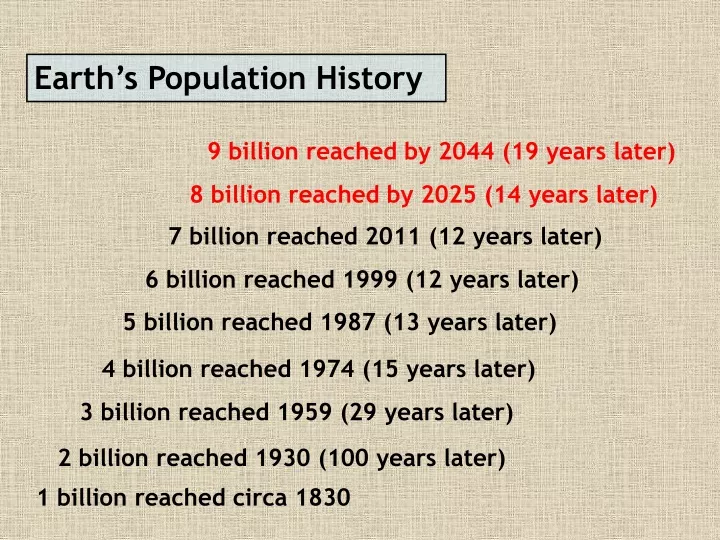
Earth’s Population History. 9 billion reached by 2044 (19 years later). 8 billion reached by 2025 (14 years later). 7 billion reached 2011 (12 years later). 6 billion reached 1999 (12 years later). 5 billion reached 1987 (13 years later). 4 billion reached 1974 (15 years later).

E N D
Earth’s Population History 9 billion reached by 2044 (19 years later) 8 billion reached by 2025 (14 years later) 7 billion reached 2011 (12 years later) 6 billion reached 1999 (12 years later) 5 billion reached 1987 (13 years later) 4 billion reached 1974 (15 years later) 3 billion reached 1959 (29 years later) 2 billion reached 1930 (100 years later) 1 billion reached circa 1830
DTM only predicts changes in birth/death rates over time Observed changes in RNI correlate to changes in economic development Thus, DTM implies: The greater the wealth, the lower the RNI ... but use caution describing this relationship
Stages in Classic 4-Stage Demographic Transition Model (DTM) (Some books show a 3-stage model; others mention a new 5th stage)
Stage 1: “Pre-Industrial” High birth rates and high death rates (both about 40) Population growth very slow Agrarian society High rates of communicable diseases Pop. increases in good growing years; declines in bad years (famine, diseases) Most deaths from infectious disease and famine issues No country or world region still in Stage One
Stage 2: “Early Industrial” High birth rates (over 30) but death rates decline (to about 20) RNIs increase sharply (pop. explosion); growth rate increases throughout Stage Two Most deaths still from infectious disease Growth not from increase in births, but from decline in deaths MDCs = starts early 1800s LDCs = starts after 1950s
TRANSITION TO STAGE TWO IN CLASSIC DTM Known as the Epidemiologic Transition Agricultural technology Improvements in food supply: higher yields as agricultural practices improved in “Second Agricultural Revolution” (18th century) In Europe, food quality improved as new foods introduced from Americas Medical technology Better medical understanding (causes of diseases; how they spread) Public sanitation technologies Improved water supply (safe drinking water) Better sewage treatment, food handling, and general personal hygiene Improvements in public health especially reduced childhood mortality
Stage 3: “Later Industrial” Birth rates decline sharply (to about 15) Death rates decline a bit more (to about 10 or less) Less deaths from infectious disease and more from aging. Note growth still occurs, but at a reduced and declining rate MDCs = starts in late 1800s LDCs = starts after 1980s* * Or hasn’t started yet
TRANSITION TO STAGE THREE IN CLASSIC DTM Known as the Fertility Transition Societies become more urban, less rural Declining childhood death in rural areas (fewer kids needed) Increasing urbanization changes traditional values about having children City living raises cost of having dependents Women more influential in childbearing decisions Increasing female literacy changes value placed on motherhood as sole measure of women’s status Women enter work force: life extends beyond family, changes attitude toward childbearing Improved contraceptive technology, availability of birth control But contraceptives not widely avail in 19th century; contributed little to fertility decline in Europe … Fertility decline relates more to change in values than to availability of any specific technology
Rapidly increasing urbanization in world LDCs today Population Classified as Urban Birth rates in urban areas are lower than birth rates in rural areas
Strong inverse relationship between female literacy and fertility rates, observed globally Increasing availability and use of modern contraception in most LDCs since 1970s
Stage 4: “Post-Industrial” Birth rates and death rates both low (about 10) Population growth very low or zero MDCs = starts after 1970s LDCs = hasn’t started yet Death from infectious disease are rare, most deaths from issues with aging Stage 5 (?): Hypothesized (not in Classic DTM) Much of Europe now or soon in population decline as birth rates drop far below replacement level
Differences in DTM experience: MDCs & LDCs ● Faster decline in death rates — Tech improvements diffused from MDCs & applied rapidly in LDCs post-WW2 ● Longer lag between decline in deaths and decline in births — Stage 3 slower start in LDCs where econ growth is delayed ● Higher max rates of growth in LDCs — Over 3.5% peak RNI in Mauritius and Mexico; only 1.3% peak in Sweden
Age structures today in LDCs are much younger than MDCs experienced – leading to prolonged “Demographic Momentum” – expected growth of pop. long after fertility declines Percentage of Population Under Age 15
Summary of DTM for LDCs Industrializing LDCs with some economic development follow DTM more closely; now in Stage Three. Most like MDCs in places where female literacy has increased the most. Lowest-income countries have high birth rates and deaths are leveling off at higher rates than DTM predicts (Stage Two). In some LDCs, death rates starting to increase (epidemics, worsening poverty)
Summary of DTM for MDCs Wealth allows for expansive food supply and advanced health care. Countries without universal pre-natal care have higher infant mortality rates Many high income countries have death rates equal to their birth rates (Stage Four). In some MDCs, death rates are surpassing birth rates (declining population, Stage 5?)