Download
1 / 20
200 likes | 305 Views
Comparing Three Computerized Methods of Assessing Delayed Discounting. Heidi L. Dempsey, David W. Dempsey, Tomesha Manora, Amanda Webster, Jody Thompson, Aaron Garrett, Iyanna Cammack, Yawa Dossou, Angel Johnston, & Michael Mitchell Jacksonville State University. Abstract.

E N D
Comparing Three Computerized Methods of Assessing Delayed Discounting Heidi L. Dempsey, David W. Dempsey, Tomesha Manora, Amanda Webster, Jody Thompson, Aaron Garrett, Iyanna Cammack, Yawa Dossou, Angel Johnston, & Michael Mitchell Jacksonville State University
Abstract • The current study compared three computerized methods of assessing delayed discounting – decreasing adjustment, double limit, and multiple-choice algorithms. Results and discussion will focus on whether each method yields similar results, as well as advantages and disadvantages of these methods (e.g., ease of administration versus tolerance of participants’ inconsistent responses).
Delayed Discounting • The term delayed discounting refers to an individual’s impulsive tendency to prefer smaller-sooner rewards over larger-later rewards. This tendency is magnified as the distance to the larger-later reward increases (e.g., waiting to receive $100 in 1 day versus 1 year). • Additionally, past research has indicated that participants tend to be less impulsive as the magnitude of the reward is increased (e.g., from $100 to $1,000) (Green, Myerson, & McFadden, 1997).
To assess discounting, participants are generally provided with a series of choices where the magnitude of the reward is varied and the time until the reward is varied. • They are given a series of choices where the dollar amount they are offered is varied and their indifference point is calculated based on the point at which they switch from choosing the larger-later reward to the smaller-sooner reward. The discounting rate is calculated based on their series of indifference points over the time periods presented (e.g., 1 day, 1 week, 1 month, etc.) (Madden & Johnson, 2010). • The current study compared three computerized methods of assessing delayed discounting – decreasing adjustment, double limit, and multiple-choice algorithms.
Decreasing Adjustment Method • The decreasing adjustment (DA) algorithm (Du, Green, & Myerson, 2002) first presents participants with a choice between the maximum future amount (e.g., $1000 in one month) and an adjusting immediate amount that was half of the maximum (e.g., $500 now). • For each subsequent choice, if they chose the maximum amount, the adjusting value was increased by half of the previous adjustment (e.g., $750 now). • If they chose the adjusting value, then the adjusting value was decreased by half of the previous adjustment (e.g., $250 now). This continues for six trials and the final value is recorded as the indifference point.
Double Limit Method • With this type of methodology, participants are quickly moved into the upper or lower value ranges based on initial choices. • The double limit (DL) method (Johnson & Bickel, 2002; Richards, Zhang, Mitchell, & deWit, 1999) uses a random adjusting-amount procedure based on a range of narrowing values. • The first choice the participant makes is between the delayed amount and a probabilistically selected adjusting amount that is between 0% and 100% (using multiples of 2%) of the value of the delayed amount.
Following each choice, an adjusting outcome is probabilistically selected from a range of values that is narrowed when consistent choices are made by the participant. • This algorithm continues until the participant responds consistently within a narrow range of values that correspond to a single indifference point. • The indifferent point is calculated by taking the value of adjusting outcome amount after the algorithm has converged. • Although this method takes more trials, it allows for participants to change their mind.
Multiple Choice Method • Both of the previous methods require participants to go through a number of trials to reach the indifference point. • We wondered whether people could make the choice simply by comparing a range of alternatives simultaneously. • Thus, the multiple-choice (MC) method involved having participants simply consider a range of possible choices from a list and choose the least amount of money they would take now, rather than wait for the larger, later amount.
Method • 67 participants who volunteered for extra credit in an Introductory Psychology Course • There were 15 males and 46 females (6 did not report their gender) • 59% were first semester freshman • 45% African American; 44% Caucasian • Nearly 50% reported their composite ACT score was in the 16-19 range
Procedure • Participants completed a computer program designed by Dempsey, Dempsey, Garrett, & Thornton (2008) to assess discounting. This program was utilized to present two magnitudes of reinforcers ($100 and $1,000) and seven possible delays (1 day, 1 week, 1 month, 6 months, 1 year, 5 years, and 25 years) for each one of the methods in question in a randomized order. • After they completed the program, the authors computed the degree of discounting exhibited by each participant for each method. This was done using the area under the indifference curve - a theoretically neutral measure of discounting.
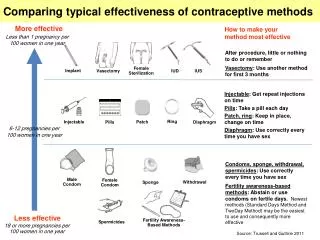
The coordinates ($, delay) of each indifference point were converted to a proportion of the total amount or delay and were plotted on a graph to create an indifference curve. Then the area under the indifference curve (AUC) was calculated by the trapezoid method, as outlined by Myerson et al. (2001). • AUC ranges from 0 (steepest possible discounting) to 1 (no discounting) for each dollar amount.
Results • A 3-factor repeated measures ANOVA was run on the three discounting methods (decreasing adjustment, double limit, and multiple choice) with AUC for $1000 as the dependent measure. • The analysis indicated that there was a significant difference between the three discounting methods, F (2, 65) = 24.83, p < .001. • In order to determine which groups were significantly different from others, pairwise comparisons were run based on estimated marginal means.
The results indicate that participants showed significantly less discounting on multiple choice method (M = 0.642, SD = .29), compared to the decreasing adjustment method (M = 0.376, SD = .31) or the double limit method (M = 0.349, SD = .30). • The DA and DL methods were not significantly different from one another (see Figure 1). • A second analysis, identical to the first, was run with AUC for $100 as the dependent measure. Again, there was a significant difference between the three discounting methods, F (2, 65) = 39.87, p < .001.
The pairwise comparisons also revealed that the MC method (M = 0.642, SD = .29) was significantly different from the DA (M = 0.376, SD = .31) and DL (M = 0.349, SD = .30) methods (see Figure 2).
The next question concerns whether these three methods are correlated with each other. That is, although they may differ from one another in terms of the overall discounting rate, the rank ordering between participants may be similar. • This would be evidenced by high correlations between the three measures. As apparent in Figure 3, the DA and MC methods only moderately correlate for the $1000 AUC, r = .41, p < .001, as do the DL and MC methods, r = .33, p < .01. • In contrast, the DA and DL methods are very highly correlated for the $1000 AUC, r = .84, p < .001 (see Figure 4).
The same pattern is evident for the $100 AUC. For each of the three methods the correlations between the $100 AUC and $1000 AUC were very high (rs ranged from .80 to .86).
Discussion • It appears that participants do not answer the multiple choice questions in the same manner in which they answer the DA and DL questions. The secondary purpose of the study was to determine if the MC scale could be used as a “quick and dirty” method to assess discounting. The answer appears to be “no.” It does not correlate very highly with the other two methods of assessing discounting and it does not appear to discriminate very well. The mean score was significantly higher than for the other two measures, the median being even higher, and it also appears to show a ceiling effect with the modal score being $950 out of $1000.
One possible explanation for this is that it requires a higher level of cognitive processing to be able answer the multiple choice questions. • Specifically, participants were asked, “What is your preference regarding the **LEAST** amount of money you would take right now, as compared to waiting to receive $1,000 in 6 months? If you are not willing to take anything less than the full amount, select the first option of $1,000 in 6 months.” • In the DA and DL methods, they were simply asked to make a choice between some amount now and waiting the specified period of time for the maximum amount. Thus, in the multiple choice method they had to make choices regarding each of the dollar amounts and derive the least amount they would take right now.
As evident from Figure 5, the vast majority did not go any lower than $950. In contrast, when making a choice-by-choice decision, the results were much more varied. Perhaps this is due to the low reading level of our participants. Nearly 50% of our sample had an ACT score in the 16-19 range which is well below the national average of 21 (see Figure 6).
In summary, it appears that either the DA or DL method would work well to assess discounting, but more work needs to be done to hash out the problems with the multiple choice method. • We are currently trying to use the multiple choice method in a context where both the delay and the reward are varied simultaneously in an experiment on study behaviors. This should eliminate some of the confusion regarding choosing the **LEAST** you would take right now. These results will also be compared with the DA assessment method for discounting of hypothetical money. • Also, we plan to begin investigating whether changing the type of underlying distribution (e.g., linear vs. exponential) affects rate of discounting.