Download
1 / 1
20 likes | 115 Views
Ionospheric fluctuations structure during strong geomagnetic storm by incoherent scatter radar and GPS data. Yu.V. CHERNIAK (1), I.I. SHAGIMURATOV ( 1 ) , A. KRANKOWSKI ( 2 ) , I.E. ZAKHARENKOVA (1 ,2 )

E N D
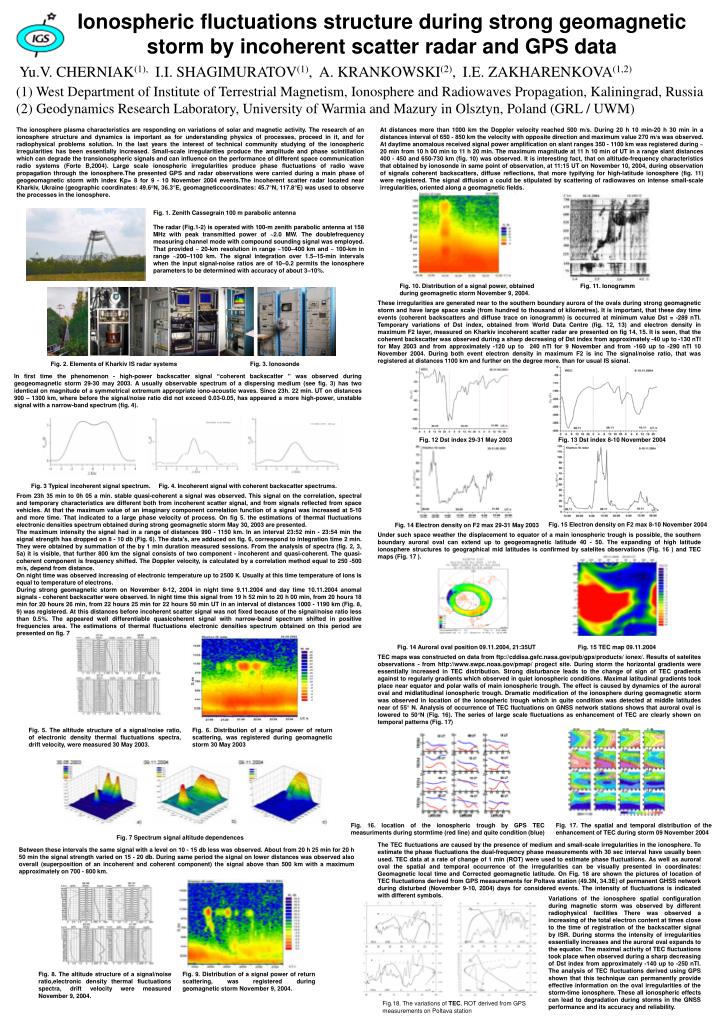
Ionospheric fluctuations structure during strong geomagnetic storm by incoherent scatter radar and GPS data Yu.V. CHERNIAK(1),I.I. SHAGIMURATOV(1),A. KRANKOWSKI(2),I.E. ZAKHARENKOVA(1,2) (1) West Department of Institute of Terrestrial Magnetism, Ionosphere and Radiowaves Propagation, Kaliningrad, Russia (2) Geodynamics Research Laboratory, University of Warmia and Mazury in Olsztyn, Poland (GRL / UWM) The ionosphere plasma characteristics are responding on variations of solar and magnetic activity. The research of an ionosphere structure and dynamics is important as for understanding physics of processes, proceed in it, and for radiophysical problems solution. In the last years the interest of technical community studying of the ionospheric irregularities has been essentially increased. Small-scale irregularities produce the amplitude and phase scintillation which can degrade the transionospheric signals and can influence on the performance of different space communication radio systems (Forte B,2004). Large scale ionospheric irregularities produce phase fluctuations of radio wave propagation through the ionosphere.The presented GPS and radar observations were carried during a main phase of geogeomagnetic storm with index Kp= 8 for 9 - 10 November 2004 events.The incoherent scatter radar located near Kharkiv, Ukraine (geographic coordinates: 49.6°N, 36.3°E, geomagneticcoordinates: 45.7°N, 117.8°E) was used to observe the processes in the ionosphere. At distances more than 1000 km the Doppler velocity reached 500 m/s. During 20 h 10 min-20 h 30 min in a distances interval of 650 - 850 km the velocity with opposite direction and maximum value 270 m/s was observed. At daytime anomalous received signal power amplification on slant ranges 350 - 1100 km was registered during ~ 20 min from 10 h 00 min to 11 h 20 min. The maximum magnitude at 11 h 10 min of UT in a range slant distances 400 - 450 and 650-730 km (fig. 10) was observed. It is interesting fact, that on altitude-frequency characteristics that obtained by ionosonde in same point of observation, at 11:15 UT on November 10, 2004, during observation of signals coherent backscatters, diffuse reflections, that more typifying for high-latitude ionosphere (fig. 11) were registered. The signal diffusion a could be stipulated by scattering of radiowaves on intense small-scale irregularities, oriented along a geomagnetic fields. Fig. 1. Zenith Cassegrain 100 m parabolic antenna The radar (Fig.1-2) is operated with 100-m zenith parabolic antenna at 158 MHz with peak transmitted power of ~2.0 MW. The doublefrequency measuring channel mode with compound sounding signal was employed. That provided ~ 20-km resolution in range ~100–400 km and ~ 100-km in range ~200–1100 km. The signal integration over 1.5–15-min intervals when the input signal-noise ratios are of 10–0.2 permits the ionosphere parameters to be determined with accuracy of about 3–10%. Fig. 10. Distribution of a signal power, obtained during geomagnetic storm November 9, 2004. Fig. 11. Ionogramm These irregularities are generated near to the southern boundary aurora of the ovals during strong geomagnetic storm and have large space scale (from hundred to thousand of kilometres). It is important, that these day time events (coherent backscatters and diffuse trace on ionogramm) is occurred at minimum value Dst = -289 nTl. Temporary variations of Dst index, obtained from World Data Centre (fig. 12, 13) and electron density in maximum F2 layer, measured on Kharkiv incoherent scatter radar are presented on fig 14, 15. It is seen, that the coherent backscatter was observed during a sharp decreasing of Dst index from approximately -40 up to -130 nTl for May 2003 and from approximately -120 up to 240 nTl for 9 November and from -160 up to -290 nTl 10 November 2004. During both event electron density in maximum F2 is inc The signal/noise ratio, that was registered at distances 1100 km and further on the degree more, than for usual IS signal. Fig. 2. Elements of Kharkiv IS radar systems Fig. 3. Ionosonde In first time the phenomenon - high-power backscatter signal “coherent backscatter ” was observed during geogeomagnetic storm 29-30 may 2003. A usually observable spectrum of a dispersing medium (see fig. 3) has two identical on magnitude of a symmetrical extremum appropriate iono-acoustic waves. Since 23h. 22 min. UT on distances 900 – 1300 km, where before the signal/noise ratio did not exceed 0.03-0.05, has appeared a more high-power, unstable signal with a narrow-band spectrum (fig. 4). Fig. 12 Dst index 29-31 May 2003 Fig. 13 Dst index 8-10 November 2004 Fig. 3 Typical incoherent signal spectrum. Fig. 4. Incoherent signal with coherent backscatter spectrums. From 23h 35 min to 0h 05 a min. stable quasi-coherent a signal was observed. This signal on the correlation, spectral and temporary characteristics are different both from incoherent scatter signal, and from signals reflected from space vehicles. At that the maximum value of an imaginary component correlation function of a signal was increased at 5-10 and more time. That indicated to a large phase velocity of process. On fig 5. the estimations of thermal fluctuations electronic densities spectrum obtained during strong geomagnetic storm May 30, 2003 are presented. The maximum intensity the signal had in a range of distances 990 - 1150 km. In an interval 23:52 min - 23:54 min the signal strength has dropped on 8 - 10 db (Fig. 6). The data's, are adduced on fig. 6, correspond to integration time 2 min. They were obtained by summation of the by 1 min duration measured sessions. From the analysis of spectra (fig. 2, 3, 5a) it is visible, that further 800 km the signal consists of two component - incoherent and quasi-coherent. The quasi-coherent component is frequency shifted. The Doppler velocity, is calculated by a correlation method equal to 250 -500 m/s, depend from distance. On night time was observed increasing of electronic temperature up to 2500 К. Usually at this time temperature of ions is equal to temperature of electrons. During strong geomagnetic storm on November 8-12, 2004 in night time 9.11.2004 and day time 10.11.2004 anomal signals - coherent backscatter were observed. In night time this signal from 19 h 52 min to 20 h 00 min, from 20 hours 18 min for 20 hours 26 min, from 22 hours 25 min for 22 hours 50 min UT in an interval of distances 1000 - 1190 km (Fig. 8, 9) was registered. At this distances before incoherent scatter signal was not fixed because of the signal/noise ratio less than 0.5%. The appeared well differentiable quasicoherent signal with narrow-band spectrum shifted in positive frequencies area. The estimations of thermal fluctuations electronic densities spectrum obtained on this period are presented on fig. 7. Fig. 15 Electron density on F2 max 8-10 November 2004 Fig. 14 Electron density on F2 max 29-31 May 2003 Under such space weather the displacement to equator of a main ionospheric trough is possible, the southern boundary auroral oval can extend up to geogeomagnetic latitude 40 - 50. The expanding of high latitude ionosphere structures to geographical mid latitudes is confirmed by satelites observations (Fig. 16 ) and TEC maps (Fig. 17 ). Fig. 14 Auroral oval position 09.11.2004, 21:35UT Fig. 15 TEC map 09.11.2004 TEC maps was constructed on data from ftp://cddisa.gsfc.nasa.gov/pub/gps/products/ ionex/. Results of satelites observations - from http://www.swpc.noaa.gov/pmap/ progect site. During storm the horizontal gradients were essentially increased in TEC distribution. Strong disturbance leads to the change of sign of TEC gradients against to regularly gradients which observed in quiet ionospheric conditions. Maximal latitudinal gradients took place near equator and polar walls of main ionospheric trough. The effect is caused by dynamics of the auroral oval and midlatitudinal ionospheric trough. Dramatic modification of the ionosphere during geomagnetic storm was observed in location of the ionospheric trough which in quite condition was detected at middle latitudes near of 55° N. Analysis of occurrence of TEC fluctuations on GNSS network stations shows that auroral oval is lowered to 50°N (Fig. 16). The series of large scale fluctuations as enhancement of TEC are clearly shown on temporal patterns (Fig. 17) Fig. 5. The altitude structure of a signal/noise ratio, of electronic density thermal fluctuations spectra, drift velocity, were measured 30 May 2003. Fig. 6. Distribution of a signal power of return scattering, was registered during geomagnetic storm 30 May 2003 Fig. 16. location of the ionospheric trough by GPS TEC measuriments during stormtime (red line) and quite condition (blue) Fig. 17. The spatial and temporal distribution of the enhancement of TEC during storm 09 November 2004 Fig. 7 Spectrum signal altitude dependences The TEC fluctuations are caused by the presence of medium and small-scale irregularities in the ionosphere. To estimate the phase fluctuations the dual-frequency phase measurements with 30 sec interval have usually been used. TEC data at a rate of change of 1 min (ROT) were used to estimate phase fluctuations. As well as auroral oval the spatial and temporal occurrence of the irregularities can be visually presented in coordinates: Geomagnetic local time and Corrected geomagnetic latitude. On Fig. 18 are shown the pictures of location of TEC fluctuations derived from GPS measurements for Poltava station (49.3N, 34.3E) of permanent GHSS network during disturbed (November 9-10, 2004) days for considered events. The intensity of fluctuations is indicated with different symbols. Between these intervals the same signal with a level on 10 - 15 db less was observed. About from 20 h 25 min for 20 h 50 min the signal strength varied on 15 - 20 db. During same period the signal on lower distances was observed also overall (superposition of an incoherent and coherent component) the signal above than 500 km with a maximum approximately on 700 - 800 km. Variations of the ionosphere spatial configuration during magnetic storm was observed by different radiophysical facilities There was observed a increasing of the total electron content at times close to the time of registration of the backscatter signal by ISR. During storms the intensity of irregularities essentially increases and the auroral oval expands to the equator. The maximal activity of TEC fluctuations took place when observed during a sharp decreasing of Dst index from approximately -140 up to -250 nTl. The analysis of TEC fluctuations derived using GPS shown that this technique can permanently provide effective information on the oval irregularities of the storm-time ionosphere. These all ionospheric effects can lead to degradation during storms in the GNSS performance and its accuracy and reliability. Fig. 8. The altitude structure of a signal/noise ratio,electronic density thermal fluctuations spectra, drift velocity were measured November 9, 2004. Fig. 9. Distribution of a signal power of return scattering, was registered during geomagnetic storm November 9, 2004. Fig.18. The variations of TEC, ROT derived from GPS measurements on Poltava station