Download
1 / 39
390 likes | 482 Views
Social determinants and Adolescent Mental Health Stephen Stansfeld Centre for Psychiatry, Wolfson Institute of Preventive Medicine, Barts & the London School of Medicine and Dentistry, London UK Addressing young people’s health inequalities

E N D
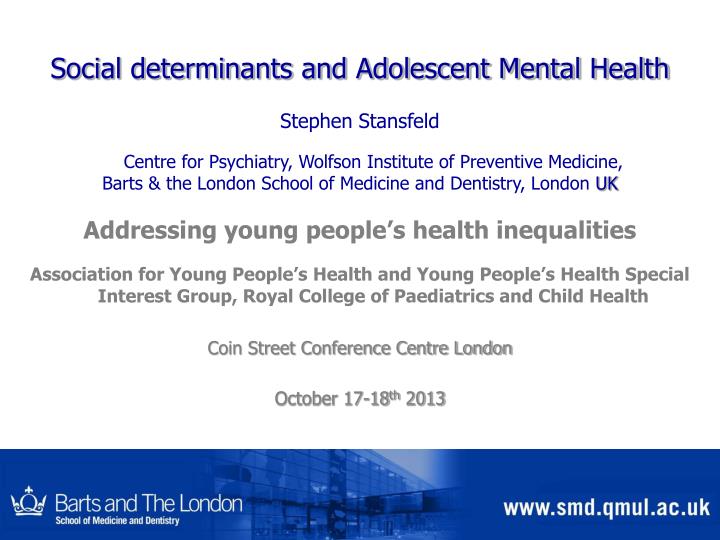
Social determinants and Adolescent Mental Health Stephen Stansfeld Centre for Psychiatry, Wolfson Institute of Preventive Medicine, Barts & the London School of Medicine and Dentistry, London UK Addressing young people’s health inequalities Association for Young People’s Health and Young People’s Health Special Interest Group, Royal College of Paediatrics and Child Health Coin Street Conference Centre London October 17-18th 2013
Outline • Pathways of influences on adolescent mental health • Effects of socioeconomic status • Neighbourhood and cultural factors • Parental and peer social support • Exposure to adversity • Conclusions
Hypothetical pathways linking income inequality and health (Kondo, 2012)
Environment Physical Social Cultural Intervening variables Nervous system Intervening variables Psychiatric Physical Illness illness
Health inequalities begin before birth Generation R Study: 9778 mothers from multi-ethnic sample in Rotterdam Low socioeconomic status associated with: Greater risk of eclampsia, raised maternal blood pressure slower foetal growth, lower birth weight, more pre-term births Infants had more respiratory infections (2 years) and more difficult temperaments (6 months) measured on a standard scale (Raat et al, 2011)
Cross-sectional associations between Father’s Social Class and childhood mental health: 1958 Birth Cohort (adjusted for gender)
Association of childhood SEP (cumulative) and CIS-R diagnoses in adulthood: 1958 Birth Cohort
RELACHS Study: Risk and Protective factors for mental health • 2790 pupils from 29 schools, 11-14 years at baseline • 68% of all secondary school age children in ELCHA are non-White (64% Hackney; 70% Newham; 71% Tower Hamlets) (DfEE 1999) • Main groups: Bangladeshi; Black African/Caribbean; Indian and Pakistani • Questionnaire administered in English as most respondents are fluent in English • Multilingual research workers recruited
Proportion with High Strengths and Difficulties score by age and sex compared with national data % High SDQ score 11-12 years RELACHS HSE Female 11.3% 7% Male 10.5% 11% 13-15 years Female 11.4% 6% Male 8% 9%
Proportion of High scorers on the Strengths and Difficulties Questionnaire by socioeconomic status and sex SES Male Female % % Parental employment One/both working 9.2 11.3 Neither working 9.4 11.4 Car ownership 0 10.6 9.4 1+ 7.9 11.9 2 10.4 11.9 Eligibility for Free School Meals No 8.4 11.7 Yes 9.9 10.9 (Stansfeld et al, 2004)
Odds ratios for poor mental health by socioeconomic status Eligibility for SDQ SDQ Free School Adjusted for Sex Adjusted Meals and Year Groups for Ethnicity No 1 1 Yes 1.03 (0.8-1.4) 1.10 (0.8-1.5)
Mean WEMWBS score by socioeconomic Indicator: ORIEL Study Significantly different to low FAS (Smith et al, in preparation)
Proportion with depressive symptoms by socioeconomic indicator: ORIEL Study% Odds of having depressive symptoms by socioeconomic indicators (Smith et al, in preparation)
Malaise symptoms (mean in past month) by social class at ages 11, 13 and 15West of Scotland 11-16 Study I II III-NM III-M IV Linear sig (West & Sweeting, 2004)
SHaW Study • Questionnaire study of Grade 8 learners (14-15 yrs) in 7 schools from Cape Town Metro Central Educational District • All co-educational schools from one administrative district stratified according to fees • Total sample size for main study =1034 • Response rate = 88% • Coloured 60%, Black 25%, White 10%, Indian 2%
Neighbourhood Quality • Moving to higher quality neighbourhoods associated with less anxiety/depression for boys (Leventhal & Brooks Gunn, 2003) • Ambient hazards related to conduct disorder, depression and anxiety (Aneshensel & Sucoff, 1996; Curtis et al, 2004)
Neighbourhood deprivation and adolescent mental health 8 Studies from North America and 2 from other parts of Europe show associations between neighbourhood deprivation and externalising and internalising problems controlling for individual and family risk factors Recent UK studies do not show significant associations (Curtis et al 2013)
Area characteristics and psychological distress • Social and economic conditions at level of ‘Middle Layer Super Output Areas’, (Census, 2001) linked with SDQ • Lower SDQ among Asian, Black groups, families with social support and no financial stress • High SDQ among those with special educational needs, long standing illness, reconstituted families • Area differences associated with 6% of variation in SDQ score Material deprivation, social fragmentation, crime did not show effects on SDQ • Better mental health for South Asians in medium rather than high or low ethnic density areas (Fagg et al, 2006)
Odds ratios for high SDQ scores by ethnic group and socioeconomic status Adjusted* for + Adjusted for Ethnicity sex and year group SES OR (95%CI) OR (95%CI) White (UK) 1 1 White (Other) 1.39 (0.8-2.3) 1.36 (0.8-2.3) Bangladeshi 0.64 (0.4-0.9) 0.63 (0.4-0.9) Pakistani 0.92 (0.4-2.1) 0.91 (0.4-2.1) Indian 1.02 (0.7-1.6) 1.03 (0.7-1.6) Black 0.89 (0.6-1.3) 0.89 (0.6-1.3) Mixed 1.16 (0.7-2.0) 1.15 (0.7-1.9) Other 0.71 (0.4-1.2) 0.71 (0.4-1.2) *Adjusted for sex, year group, and interaction sex x year group (Stansfeld et al, 2004)
RELACHS Study: Odds ratios for Mood and Feelings Questionnaire caseness by ethnic group and socioeconomic status Adjusted* for + Adjusted for Ethnicity sex and year group SES OR (95%CI) OR (95%CI) White (UK) 1 White (Other) 1.53 (1.1-2.2) 1.54 (1.1-2.2) Bangladeshi 0.92 (0.7-1.3) 0.92 (0.7-1.3) Pakistani 0.97 (0.6-1.6) 0.97 (0.6-1.6) Indian 1.01 (0.7-1.5) 1.01 (0.7-1.5) Black 0.94 (0.7-1.2) 0.94 (0.7-1.3) Mixed 1.25 (0.8-1.9) 1.25 (0.8-1.9) Other 1.26 (0.8-1.9) 1.27 (0.8-1.9) *Adjusted for sex, year group, and interaction sex x year group (Stansfeld et al, 2004)
Risk for psychological distress and depressive symptoms: adjustment for recent migration
Cultural Identity and Psychological Distress • Integrated friendship choices (OR= 0.6, 95% CI 0.4-0.9) boys (OR= 0.5, 95% CI 0.2-0.9) and Bangladeshi pupils (OR= 0.15, 95% CI 0.04-0.6) protective of psychological distress relative to marginalised identity (Bhui et al, 2005) • In longitudinal analysis traditional identity based on clothing choice was protective for Bangladeshi girls (Bhui et al, 2008)
Area social fragmentation, social support and mental health High levels of social cohesion are beneficial for mental health (Aneshesel & Sucoff, 1996) Health Survey for England 2002 – 5,777, 16-24 years old Social fragmentation in geographical areas was a risk factor for mental ill-health Family social support for the individual was independently protective for mental health The benefits of social support did not vary by area (Fagg et al 2008)
Low Medium High Social support and odds of distress in HSE respondents from areas of low, medium, high area fragmentation
Prospective Associations between Social Support and Mental Health Outcomes • Low family social support at baseline was associated with a higher risk of depressive symptoms at follow-up in adjusted models* (OR=2.33, 95% CI: 1.31-4.13) • A decrease in family social support over time was associated with a higher risk of depressive symptoms at follow-up in adjusted models* (OR=2.14, 95% CI 1.13-4.07) (Khatib et al, 2013) *Adjusted for age, gender, an interaction between age and gender, socio-economic status (eligibility for free school meals, parental employment status, parental ownership of vehicle), ethnicity, and country of birth, length of time in the UK
Key Findings: Can Social Support Account for Ethnic Variations in Mental Health Outcomes? • *Adjusted for age, gender, an interaction between age and gender, socio-economic status (eligibility for free school meals, parental employment status, parental ownership of vehicle), ethnicity and country of birth, length of time in the UK and SOCIAL SUPPORT
Peer relationships • Broadly positive impact of peer support on depressive symptoms • Association with delinquent peer group may have particularly negative effects • Unsupervised peer contact associated with behavioural problems • Peer rejection associated with depression but not always with behavioural difficulties (Stansfeld et al unpublished)
Early lack of care, abuse, neglect and depression Parental indifference, physical, sexual abuse predict depression (Brown et al, 1993; Bifulco et al, 1994) Relationship between childhood neglect and abuse and adult depression ‘explained by’ depression before the age of 20y (Bifulco et al, 1998) Experience of childhood abuse and neglect may predict subsequent poor parenting – intergenerational transmission risk (Andrews et al, 1990)
Neighbourhood Violence and Mental Health “Exposure” to violence includes: living in a neighbourhood with a high crime rate: witnessing violence: perceptions of the neighbourhood as risky: direct experience of victimisation: Strong relationships with post-traumatic stress disorder, psychological distress, internalizing and externalising behaviours, low self esteem, suicidal cognition, depression, anger, sadness, anxiety , aggression, conduct disorders and anti-social behaviour. Energy expended in coping with community violence may be at the cost of school, work and personal relationships (Cooley-Quille et al, 2001)
Exposure to violence and risk of depressive symptoms: SHaW Study Unadjusted Fully adjusted Harvard Trauma OR 95% CI OR 95% CI Questionnaire Quartile 1 1 1 2 1.78 (1.05, 2.99) 1.74 (0.98, 3.11) 3 3.28 (1.99, 5.41) 2.69 (1.49, 4.84) 4 5.48 (3.34, 9.00) 4.72 (2.52, 8.84) *Adjusted for sex, ethnicity, social position, physical health, risk behaviours and social support
Conclusions Less advantaged socioeconomic status is associated with poorer mental health in some but not all studies Adverse neighbourhoods and exposure to violence tend to be associated with poorer mental health Cultural influences and social support can be important protective factors Interventions are needed that span areas, generations and the lifecourse