Download
1 / 50
500 likes | 747 Views
Transportation Border Working Group Ottawa: November 7, 2012 . Pembina - Emerson Port of Entry Study David Lettner: Manitoba Infrastructure and Transportation. The Pembina - Emerson Study Partnership. Project Steering Committee (PSC). Acknowledgements: Project Steering Committee.

E N D
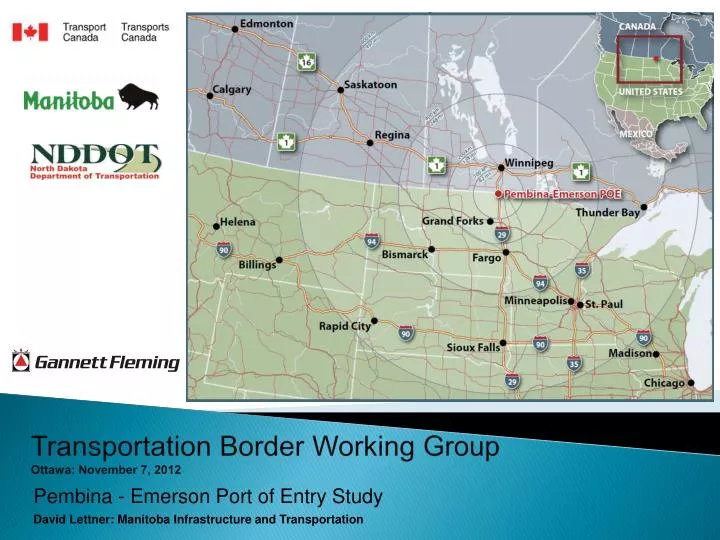
TransportationBorder Working Group Ottawa: November 7, 2012 Pembina - Emerson Port of Entry Study David Lettner: Manitoba Infrastructure and Transportation
The Pembina - Emerson Study Partnership Project Steering Committee (PSC)
Acknowledgements: Project Steering Committee Manitoba Infrastructure and Transportation (MIT) • David Lettner, Project Manager and PSC Chair • Walter Burdz (P. Eng.), Executive Director Highway Engineering • Brett Wareham (P. Eng.), Director of Regional Operations (Region 1) North Dakota Department of Transportation (NDDOT) • Jack Olson, Assistant Division Director, Planning and Programming • Les Noehre (P.E.), Grand Forks District Engineer Transport Canada (TC) • Susan Zacharias, Policy Coordinator (Prairie and Northern Region) Canada Border Services Agency (CBSA) • Blair Downey, Chief of Operations (Southern Manitoba District) Customs and Border Protection (CBP) • Jason Schmelz, Assistant Port Director (Pembina) General Services Administration (GSA) • Bryan Sayler, Property Manger (North Dakota Field Ofice)
Acknowledgements TBWG: Bi-national institutional support • Policy context and alignment of planning strategies • Sharing of best practices / experiences • Technology applications, studies and data sources • Peer network (agency subject matter experts) and agency perspectives • Timely exposure to emerging funding opportunities • TBWG website (past plenary session archives) NDDOT: Previous regional level initiatives • FHWA Coordinated Border Infrastructure Grant application (1999) • NDDOT lead agency (with Manitoba / Saskatchewan participation + funding) • Initial regional level work / study on border infrastructure coordination issues
Presentation Overview • Project Background and Context • Existing Situation / Historical Activity • Planning Principles / Best Practices • Key Study Methodologies • Proposed Port Concept / Measures of Effectiveness
Generalized Project Milestones(2009-2012) • 2009 • Initial inter-agency meeting (precursor to project steering committee - PSC) • GBCF Application to TC • 2010 • GBCF Contribution Agreement (CA) signed between MIT and TC • MOU and CA signed between MIT and NDDOT • 2011 • PSC formed • ESP registry / TOR finalized / RFP process / ESP retained (study start date Oct 5) • 2012 • Phase 1-Concept Planning completed (broad agency consensus for concept) • Phase 2-Functional Design mobilized (MIT: transportation infrastructure)
Phase 1-Conceptual Planning (Project Governance) 40+ stakeholders 30+ agency specialists
Phase 1-Conceptual Planning (Study Objectives) Primary Study Objectives: • At a conceptual level of detail: to prepare a long-range concept plan for the P-E POE that identifies the general level of transportation infrastructure and border services facility improvements required to meet anticipated demand to the year 2035. • To gain consensus on the recommended long-range concept plan for the P-E POE from all transportation agency funding partners (TC, MIT, NDDOT) and bi-national border service agencies (CBSA, CBP, GSA) • To develop and implement a long-term collaborative mechanism for maintaining stewardship for the P-E POE concept plan and working collaboratively toward implementation of the recommended concept
Existing Situation (functional flows + operational analysis)
Existing Situation (SB improvements 2011-2012) • SB improvements:$1.7M • $525K for VMS • $1.2M for pavements
Planning Principles | Best Practices Optimize Public Investments: • CBP 1997 $14.5M • CBSA 1999 $10.5M • MIT 1996 / 2012 $7.0M + • Utilize appropriate methodologies to justify future transportation / port improvements and expenditures (demand-capacity analysis / benefit-cost) Hierarchical Land Assignment Strategies: • Essential transportation and border service functions take priority over non-essential functions • Locate non-essential port functions further from Canada-USA border wherever possible (ex: duty free operations) Operational and Phasing Considerations: • Integrate and optimize advance notification, channelization and lane assignment strategies to facilitate vehicle throughput • Phasing considerations related to impact on businesses, project delivery implications for public agencies (6-10 year project delivery cycle)
Best Practices (TDM / TSM thinking) Transportation Demand Management (TDM) • TDM strategies are intended to reduce demand on facilities and infrastructure during peak periodsby modifying travel behaviour • Providing access to delay and congestion data for port users • Using ITS applications like BIFA to provide real time traveller information • Promoting uptake of trusted traveller / trader programs (NEXUS / FAST) Transportation System Management (TSM) • TSM strategies are intended to optimize the use of existing or proposed facilities and infrastructurethrough better management and operational practices • Data collection • Advance notification, channelization, lane assignment strategies • Optimizing flexibility & cross-over functions of PIL infrastructure
Key Study Methodologies (Methodology Integration) Vehicle Demand Forecasts • Hourly arrivals by vehicle category (autos, trucks) • Hourly data: Synchro-Sim Traffic and undertake LOS analysis Synchro-Sim Traffic Simulation Model • 30th highest hour: establish design parameters (ex: # PIL booths) • Establish trigger points for phasing in improvements Level of Service (LOS) Framework • Sensitivity analysis to verify and refine phasing of improvements • Capability to assess various processing / infrastructure scenarios • Verification of Synchro-Sim queue lengths
Methodology Integration | Best Practices Hourly traffic volumes to 2035 Vehicle Forecasts SynchroSim LOS Analysis LOS and Synchro-Sim corroboration / cross-validation Sensitivity analysis to assess various processing / infrastructure scenarios 30th highest hour / 99th percentile to establish facility design requirements
Rationale for Forecasting Approach • Objective: To develop custom algorithms which take annual forecasts (to 2035) by vehicle type and distribute this data on an hourly and daily basis to uncover peaking characteristics and patterns for the two primary vehicle classes (trucks / autos) • Needs: Historical hourly data by vehicle type (trucks / auto) needed to develop algorithms which replicated historical patterns. CBSA and CBP provided excellent historical data (hourly volumes by vehicle type) over a 7-10 year period for the P-E POE • Benefits: Ability to assess daily and hourly peaking impacts on port facilities and determine requirements for key infrastructure components such as PIL booths with greater degree of statistical confidence (+ / - .5% standard deviation)
Forecast Methodology & Demand Scenarios Vehicle Forecasts: Compilation of three vehicle categories • Buses (ex: 2011: 2,250 vehicles / 0.2% of total traffic) • Trend line analysis (exponential trend line decrease from 1993-2010) • Autos (ex: 2011: 642,348 vehicles / 62.3% of total traffic) • Trend line analysis (linear trend line increase of 3.5% from 1993-2010) • Custom algorithms developed to distribute annual forecast data for: • Every hour of every day (to 2035) based on custom expansion factors • Trucks (ex: 2011: 385,725 vehicles / 37.5% of total traffic) • NFFI data for top 30 commodity groups converted into truck movements • Custom algorithms developed to distribute annual forecast data for: • Every hour of every day (to 2035) based on custom expansion factors • FHWA vehicle classes / Gross vehicle weight / volume • route splits (I-29 and I-94) / traffic splits (SB / NB) • Percentage of empty backhauls
Forecasts: Buses • NB and SB bus traffic exhibited an • exponentially decreasing trend-line • between 1993 and 2010 • From 2012 to 2035 a “bottom” • equilibrium value was established that • reflected 40% of mid-1990 values • As buses were such a small amount • of the traffic stream (< 0.2%), and in declining numbers, bus traffic was removed from the forecast projections
Forecasts: Autos High +1% Medium Low -1% • From 1993 to 2010, auto traffic increased by 3.5% for both NB and SB directions • A 3.5% annual growth rate (Med) was applied to autos for the 2012 to 2035 forecast period
Forecasts: Trucks Annual Trucks Bi-Directional High +1% Medium Low -1% • NFFI commodity data used to establish truck forecasts from 2012-2025 • NFFI data was extrapolated for the 2025-2035 forecast period
Capturing Forecast Peaks The Rationale Behind Developing Algorithms Algorithms were developed to translate annual forecasts into daily and hourly forecasts to more accurately capture peaking patterns and characteristics necessary to assess facility and infrastructure requirements 9 million data points were required to obtain hourly arrival rates to the year 2035 Traffic Volume Annual Growth Forecast Trendline Forecast Period
Synchro-Sim(SB volume / capacity analysis) Calc for Max hourly theoretical PIL capacity: (3 different auto dwell time scenarios) 120 sec PIL dwell time = 30 veh /hr / PIL (30 veh x 6 PILs = 180 veh / hr) 90 sec PIL dwell time = 40 veh / hr / PIL (40 veh x 6 PILS = 240 veh / hr) 60 sec PIL dwell time = 60 veh / hr / PIL (60 veh x 6 PILS = 360 veh / hr)
Synchro-Sim(NB volume / capacity analysis) Calc for Max hourly theoretical PIL capacity: (3 different auto dwell time scenarios) 120 sec PIL dwell time = 30 veh /hr / PIL (30 veh x 4 PILS = 120 veh / hr) 90 sec PIL dwell time = 40 veh / hr / PIL (40 veh x 4 PILS = 160 veh / hr) 60 sec PIL dwell time = 60 veh / hr / PIL 60 veh x 4 PILS = 240 veh / hr)
Delay Factor Analysis (Synchro output + LOS framework) • Frequency: Number of occurrences • Magnitude: Delay to individual vehicles • Duration: length of delay period • Day and Date: Holidays (day of the week or fixed date) • Vehicle Type: Truck / Auto peaking characteristics
Level of Service (LOS) Framework LOS Framework Criteria Magnitude of delay: Delay to individual vehicles Duration of delay: Delay period for queued vehicles Volume / Capacity Ratio: Ratio of hourly arrivals to max. theoretical processing capacity
Approach to Populating LOS Output Tables Develop custom algorithms that calculate: • Average wait times per vehicle for each forecast hour based on the “state” of demand (unsaturated, build-up, saturated, dissipation) • Wait times converted to LOS categories (A to F) based on custom service time parameters stipulated in LOS framework • Total number of hours in each LOS category (A, B, C, D, E, F) aggregated by forecast year
Graphical Representation of LOS Algorithms TYPICAL PEAKING SCENARIO State 1: Unsaturated – No delay State 2: Build-up – Arrivals exceed processing capacity State 3: Saturated – Arrivals and / or queue exceed processing capacity State 4: Dissipation – Arrivals and queue less than processing capacity
Approach to Interpreting LOS Output Tables Flexibility of custom algorithms that calculate LOS: • The algorithms (once developed) have unlimited simulation capability to test infrastructure and service level parameters based on the LOS framework • PIL dwell time: Impact of processing protocols / technologies • Number of PILS: Impact of built infrastructure / staffing levels • This is the distinct advantage of the LOS framework over models like Synchro-Sim which would require simulation runs for every hour in a year (8,760 hourly runs) to obtain the same result for any given forecast year
Key Southbound and Northbound Elements Southbound and Northbound • Utilize PTH 75 and I-29 for passenger vehicle traffic approach to PIL plaza • Construct 2 new dedicated commercial lanes (FAST / non-FAST) Southbound • Convert all CBP commercial PILS to high / low booths • New secondary commercial inspection facility Northbound • New CBSA commercial plaza (4 PILS, VACIS, secondary) • New commercial service road connection to PTH 75 Access Management • New Emerson Access Road at PTH 75 / PR 243 junction
Preliminary Cost Estimates Preliminary Order of Magnitude Cost Estimates • $47.4M • 24-1 benefit-cost ratio for full concept build-out Canada (NB and SB) • $3M: MIT (transportation infrastructure) • $30.5M: CBSA (border service facilities) United States (NB and SB) • $1.7M: NDDOT ( transportation infrastructure) • $12.2M: CBP (border service facilities)
Presented by: David E. Lettner, BA, MPA, MCIP Project Manager: Pembina-Emerson Port of Entry Transportation Study Senior Transportation Planning Consultant Manitoba Infrastructure and Transportation Transportation Systems Planning Branch CONTACT: 215 Garry Street, Winnipeg, Manitoba, Canada, R3C 3P3 T: 204.945.5270 E: david.lettner@gov.mb.ca