Download
1 / 45
450 likes | 566 Views
The Impact of a Character Intervention on Student Outcomes: Results From Three Years of the Positive Action Program in the Chicago Randomized Trial. David L. DuBois, Ph.D., Professor, Public Health, University of Illinois at Chicago Peter Ji, Ph.D., Research Associate, Psychology

E N D
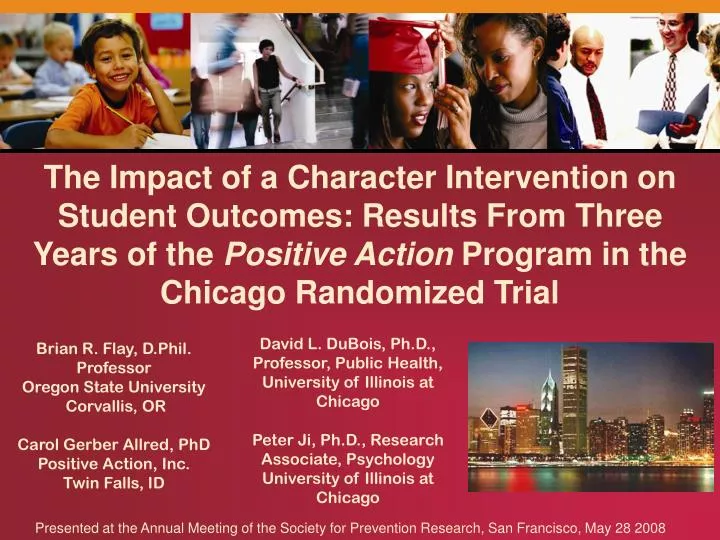
The Impact of a Character Intervention on Student Outcomes: Results From Three Years of the Positive Action Program in the Chicago Randomized Trial David L. DuBois, Ph.D., Professor, Public Health, University of Illinois at Chicago Peter Ji, Ph.D., Research Associate, Psychology University of Illinois at Chicago Brian R. Flay, D.Phil. Professor Oregon State University Corvallis, OR Carol Gerber Allred, PhD Positive Action, Inc. Twin Falls, ID Presented at the Annual Meeting of the Society for Prevention Research, San Francisco, May 28 2008
Outline • The Positive Action program philosophy/theory and components • Prior evaluations and results • Design of the Chicago study • Results from the Chicago study • Conclusions 2
I. Overview of PA Program • Positive Action (PA) is a comprehensive school-based program designed to • promote student character and positive behavior, • prevent an array of student problem behaviors, and • improve student achievement. • PA is grounded in a broad theory of self-concept that posits • (a) students’ self-concepts and characters are determined by how they behave and how they feel about themselves when they do various behaviors and • (b) making positive and healthy behavioral choices results in feelings of self-worth. • Major features of the program include: • Teacher delivered scripted PA curriculum lessons in classroom • Teacher and school staff modeling/reinforcement of “PA behaviors” inside and outside of the classroom • School-wide activities (e.g., PA assemblies) led by principal and PA Committee 3
Positive ActionOverview • The core of Positive Action is contained in an underlying philosophy. • The philosophy is described in the Thoughts-Actions-Feelings Circle. • Positive Action teaches the positive actions for the whole self through six units that are contained in five program components. • The five completely prepared components are: • K–12 curriculum, • Climate Development, • Counselors program, • Family program, and • Community program. 4
Basic Philosophy (Theory of Action)of the Positive Action Program & Circle You feel good about yourself when you do positive actions.Cognitive Behavior Therapy and Positive Psychology 5
Basic Philosophy (Theory of Action)of the Positive Action Program & Circle ...and You feel bad about yourself when you do negative actions. C.F. Depression 6
The Positive Action Program Targets Multiple Behaviors • By teaching that: • When you do good, you feel good • And there’s always a positive way of doing things AND • By teaching that doing positive actions helps: • Individuals, families, schools and communities develop positive self identities. 7
Problem-specific Usually only one behavior or one skill Start too late Upper elementary or middle school Limited intensity and dose Often only once a week for 10–20 sessions Ecologically limited Usually only in the classroom Limited effect sizes Average effect sizes in the 0.2 to 0.4 range Effects not sustained Few effects beyond one year, let alone into high school Limitations of Behavior-Specific Programs 8
The POSITIVE ACTION Program Components • K–12 classroom curriculum • over 1,200 lessons - using Teacher’s Kits (manuals and materials for each grade), classroom teachers present 15–20-minute lessons • Principal’s Kits (Elementary and Secondary) • a school-climate program to promote the practice and reinforcement of positive actions in the whole school population (students and staff) • Counselor’s Kit • used with selected individual students, small groups and families • Family Kit • contains prepared weekly home lessons paralleling the school program along with school parent-involvement activities • Community Kit • manuals and materials that align and encourage collaboration of all the environments (schools, families and community) involved in the program 9
Positive Action Focus Units(Learning Goals) • In the classroom curriculum and all other materials, the Positive Action content is taught through six focus units. Unit 1:Self-Concept: What It Is, How It’s Formed, and Why It’s Important (Philosophy & Circle) Unit 2:Physical and Intellectual Positive Actions for a Healthy Body and Mind (includes motivation to learn) Unit 3:Social/Emotional Positive Actions for Managing Yourself Responsibly Unit 4:Social/Emotional Positive Actions for Getting Along with Others by Treating Them the Way You Like to Be Treated (Social-Emotional Skills & Character) Unit 5:Social/Emotional Positive Actions for Being Honest with Yourself and Others (Mental Health) Unit 6:Social/Emotional Positive Actions for Improving Yourself Continually (Setting & Achieving Goals) 10
Logic/Theoretic Model of the Expected Effects of the Positive Action Program Program Components Immediate Outcomes Climate Development, Family Kit, Teacher/Staff Training, K–12 Instruction Curriculum, Drug Education Supplements, Community Kit, Counseling Kit * Improved relationships among school administrators, teachers, parents & community. * Improved classroom management. * Increased involvement of school with parents & community. Improved Learning Environment Expected Impact Expected Effects PA Unit Fewer Disciplinary Problems; Reduced Substance Use; Less Violence Attitudes Toward Behaviors, Social Normative Beliefs, Self-Efficacy • Improved character/self-concept • Learning/Study skills • Self-Management • Interpersonal/social skills • Self-honesty, responsibility • Goal setting, future orientation Improved Social and Character Development Improved School Attendance, Grades and Test Scores 11
Mapping of Positive Action Components Onto The Theory of Triadic Influence CLASSROOM SCHOOL FAMILY COMMUNITY Positive Action Program Components and Lessons (Exist in each Component) IntraPersonal (Individual) Social Context/ Situations Socio-Cultural Environment Genetics Biology Personality Family School Neighborhood Peers Mass Media Regulations Religion Economy Feelings Empathy Self Concept Social Bonding/ Attachment Others’ Behavior & Approval General Values Information Environment Sense of Self Social Competence Health & Drug Info Positive Role Models How to Treat Others Self Management Time, Energy, Talents, Money, Anger Self- Determination Social Skills Others’ Expectations Desire to Please Evaluation of Outcomes Expected Consequences Communica -tion Skills How You Like To Be Treated Thinking Skills Creativity Decision-Making Problem-Solving Conflict Resolution Social & Emotional Health Social Normative Beliefs Attitudes Toward the Behavior Self-Efficacy INTENTIONS/DECISIONS BEHAVIOR Experiences from Behavior 12
II. Prior Evaluations of PA • Early Studies of the PA Program’s Effectson Self-Concept • Effects of the Positive Action Program on Achievement and Discipline: Two Matched-Control Comparisons in Hawai’i and Nevada Elementary Schools (Flay, Allred & Ordway, 2001) • Long-term Effects of the Positive Action Program (Flay & Allred, 2003) • Utah State Annual Report of PA Family Classes Outcomes • Randomized Trial of PA in Hawaii Elementary School • Randomized Trial in Chicago Public Schools 13
In a prior quasi-experimental study, relative to elementary schools without PA, matched schools with PA reported: • Major reductions in problem behaviors • Up to 85% reductions in violence • Up to 71% reductions in substance use • Up to 90% fewer general disciplinary actions (with effects sometimes being larger in schools with higher levels of student poverty) • Up to 80% fewer suspensions • Up to 94% reductions in criminal bookings • Major improvements in school performance • Up to 60% reductions of absenteeism, • Up to 13% lower rates of chronic absenteeism. • Up to 100% improvements on standardized achievement scores, • Many schools report moving from one of the lowest scoring to one of the highest scoring in their district or state • Publication: Flay, Allred & Ordway, Am J. Health Behavior, 2001 • The matched-control study was replicated by Flay & Allred (Prevention Science, 2003) with the addition of pretest matching data. 14
III. The Chicago Randomized Trial of Positive Action • UIC/OSU school-based randomized trial • One site of a 7-site study funded by the IES of the US DoED • Schools randomly assigned from 7 matched pairs • Matched on school-level demographic variables, achievement and disciplinary referrals • Data collected from students and their teachers and parents, and school leadership (principal and PA Coordinator) • Beginning and end of grades 3 & 4 and end of grade 5 • Program Implementation and Outcomes • Teacher amount and integrity of program delivery • Parent involvement with program and schools • Teacher classroom management • Student character and behavior • Student school attendance and achievement test scores • Also school records data on achievement, attendance and disciplinary referrals • Last wave of data collection Spring 2007 20
Research Design • 7 matched pairs of schools randomly assigned to 2 conditions: • Early Starters: Start the program in the 2004-05 school year OR • Late Starters: Start the program 3 years later (2007-08 school year) • Schools eligible for inclusion were: • Community-based (No Magnet or Charter schools), Have not already used Positive Action, Not already participating in related projects (Project Northland, All Stars), • Enrollment > 50 and < 140 students per grade • Mobility rate no greater than 40% • More than 50% of students receive free or reduced price lunch • Less than 50% of students met achievement criteria on the ISAT • Schools matched into pairs before randomization: • Achievement scores, School size – enrollment, Ethnic Distribution, % Mobility, % Free/Reduced Lunch, Attendance and Truancy Rates, % Parent Involvement, % Teachers not meeting minimal requirements, CPS Region, Community crime statistics 21
Research Design 2 • Follow one cohort of students from the beginning of grade 3 to the end of grade 5 • Signed parental consent – 98.3% returned, 79.7% Yes • Surveys of students, teachers and parents at beginning and end of grades 3 and 4, and end of grade 5. • Teachers complete behavior rating scales on students in their class at beginning and end of grades 3 and 4, and at the end of grade 5. • Some of the measures are multi-site – collected by a national contractor (Mathematica Policy Research – MPR) at each of the 7 sites – and not available to PIs until about a year later • Some of the measures are site-specific – specific to our evaluation of the Positive Action program – collected by UIC research staff 22
Assessment of Program Impact • Multi-site – data collected with student, parent, and teacher surveys used by all SACD sites • Local site – data collected with student survey used by Chicago SACD site only • Data collected only on cohort of students that was in 3rd grade at start of study (Fall ’04) • Outcomes assessed at 5 time points • Year 1: Fall ’04 (T1), Spring ’05 (T2) • Year 2: Fall ’05 (T3), Spring ’06 (T4) • Year 3: Spring ’07 (T5) 23
Outcome Measures - Multi-site • Student (S), Parent (P), and Teacher (T) Surveys • Behavioral – BASC Aggression and Conduct Problem (P/T); Frequency of Delinquent Behavior (S); Social Competence—Prosocial Behavior (T) • Emotional – Empathy (S); Emotional Regulation (P, T) • Academic – Engagement vs. Disaffection for Learning (S); Academic Competence (T) • Not utilized for impact analyses in this presentation pending release of report of findings from the multi-site study • School Records – student grades, standardized test scores, attendance, discipline—some of these data are not yet available 24
Outcome Measures – Local • Behavioral • Social Problem Solving (.44) – Aggressive (.50), Competence (.58) • Positive Health Behavior – Hygiene (.48), Food and Exercise (.43) • Emotional • Affect - Positive (.68), Negative (.74) • Self-Esteem – Peer (.71), School (.68), Family (.75), Appearance (.66), Sports (.72), Global (.61) • Self-Esteem Formation – Positive (.74), Negative (.75) • Self-Esteem Process – Motivation (.73), Control (.34) • Life Satisfaction (.70) • Academic • Student report of grades • Mediators • Character and Social Development Scales (CASD) • Belief in the Moral Order – Positive values (.59), Negative values (.59) • Attachment – School (.74), Teacher (.68), Parents (.54), Friends (.71) • Rewards for Prosocial Behavior – Parents (.72), Teachers (.80) • Conventional Friends - Good friends (.57), Bad friends (.76) • Neighborhood Youth Inventory (.69) Note: Coefficient alphas in parentheses 25
Implementation Measures Ratings of Implementation Fidelity Consultation Notes Teacher Interview Weekly Implementation Reports Unit Implementation Reports End-of-Year Survey PA Committee Roster Form PA Budget PA Expenditures Report PA Committee Meeting Report Form PA School Activity Form End-of-Year Implementation Survey PA Research Team Classroom Teachers PA School Coordinators PA Budget and Expenditures Report End-of-Year Implementation Survey Principal PA Committee Members PA Committee Meeting Attendance Log and Report Form Any School Staff Person Students PA Mid Year and End-of-Year Student Survey PA Program Observation Form 26
Results 2: Impact Analyses • SAS PROC Mixed - Standard errors adjusted for clustering of students within schools • Model included school-level random intercept • Classroom level error term was excluded • Model did not include the pair-wise matching of schools • Covariates – • Student gender, student age, parent ethnicity, parent education level, # of people in household • T1 score on the criterion measure • T1 Negative school orientation – Student Report • T1 Normative beliefs about aggression – Student Report • T1 Victimization at school – Student Report • T1 Confusion, Hubbub and Order – Parent Report • T1 ADHD Symptomology – Teacher Report 29
Impact Analyses Results • At baseline, ES and LS demonstrated equivalence on all school-level variables (next slide) and all but four outcomes (positive values, parent and teacher rewards for prosocial behavior, bad friends: ES < LS). • Results indicate multiple emerging (.05 < p < .10) and significant (p < .05, two-tailed) program effects 30
Latent Growth Curve Analysis and Effect Sizes for Local-site Student Level Outcome Scales: Summary of Noteworthy Findings Notes: All significance levels one-tailed; *** p < .05, ** p < .10. Condition was coded as 0 = Control; 1 = PA. T vs. C denotes estimated difference (unstandardized) in slope between Treatment and Control schools. % change = (a – b) x 100, where by a = the treatment wave 4 or 5 mean divided by the control wave 4 or 5 mean and b = the treatment wave 1 mean divided by the control wave 1 mean.Cohen ES = a – b, where a = (treatment wave 4 or 5 mean – control wave 4 or 5 mean) / pooled standard deviation and b = (treatment wave 1 mean – control wave 1 mean) / pooled standard deviation. For all scales, higher scores indicate more of the construct. 33
P.S. Similar reductions in the multi-site measure of Problem Behavior 34
Effects on School-Level reports of misconducts and suspensions In ANCOVA models predicting year 4 differences from year 1 levels and condition, differences at year 4 are marginally significant for misconducts (p = .054) and significant for suspensions (p = .037) using one-tailed tests. 37
V. Conclusions • Implementing school-wide character education programs to address a wide range of outcomes is challenging • Limited resources of urban school systems • NCLB • Evaluation of school-based character/social development programs is complicated by control schools implementing similar programs under “business as usual” conditions • Multiple program effects were obtained after 3 years of programming • School-level reports of misconducts and suspensions strengthen the robustness of the findings • Time trends in outcomes suggest increasing effects over time • School-wide social and character development education can be effective at: • decreasing multiple negative behaviors and • increasing multiple positive behaviors 40
Future Research • Investigate potential differential impacts of PA based on student gender, child risk level, etc. • Investigate whether schools with different levels in the quality of implementation yield different “impacts” • Validate SACD scales with observed student behavior • Examine impact of PA as student cohort progresses into upper elementary grades (grades 6-8) • Critical transitional period within emotional, behavioral, and academic domains 41
Future Work/Needs – The bigger picture • Larger scale trials • ICCs for attitudes (.03-.1) and behavior (.01-.05) are generally smaller than for achievement (.15-.2) • Still need Ns of 10-20 per condition rather than 7 • Improved measures of integrity and dosage delivered and received • Teacher, student and observer reports • Contractual reporting systems? • Longer term follow-ups • Effects take several years to even start emerging • Prior work suggests important long-term effects are possible • Methods of analysis to accommodate differential implementation • Propensity scoring, CACE, instrumental variable 42
Acknowledgment The findings reported here are based on research conducted by the authors as part of the Social and Character Development (SACD) research program funded by the Institute of Education Sciences (IES), U.S. Department of Education through Grant # R215S020218 to the University of Illinois at Chicago (2003-2005) and Oregon State University (2005-2008). The SACD Consortium consists of representatives from IES, the Centers for Disease Control and Prevention (CDC), and the national evaluation contractor, Mathematica Policy Research, Inc. (MPR), and each grantee site participating in the evaluation. The content of this presentation does not necessarily reflect the views or policies of the SACD Consortium members including IES, CDC, and MPR, nor does mention of trade names, commercial products, or organizations imply endorsement by the U.S. Government. Correspondence concerning this presentation should be addressed to Brian R. Flay, D.Phil., Principle Investigator, Department of Public Health, 254 Waldo Hall, Oregon State University, Corvallis, OR 97330, brian.flay@oregonstate.edu. 43
SACD disclaimer statement: The Social and Character Development (SACD) research program funded by the Institute of Education Sciences (IES), U.S. Department of Education includes a national evaluation study conducted by Mathematica Policy Research (MPR), and complementary research studies conducted by each grantee. The findings reported here are based on the complementary research activities carried out by Brian Flay, Oregon State University, and David L. DuBois, University of Illinois at Chicago, under the SACD program. These findings may differ from the results reported for the SACD national evaluation study. The findings presented in this conference presentation are based on a smaller sample size of children, classrooms, and teachers, utilized a different set of outcome measures, and sought to answer complementary research questions. The content of this presentation does not necessarily reflect the views or policies of the SACD Consortium including IES, CDC, and MPR, nor does mention of trade names, commercial products, or organizations imply endorsement by the U.S. Department of Education. 44