Download
1 / 1
10 likes | 107 Views
recipient journal. The normalization factor used is the total number of references of the transferring journal in the year under study. The citation time window is set to three years, so that journal

E N D
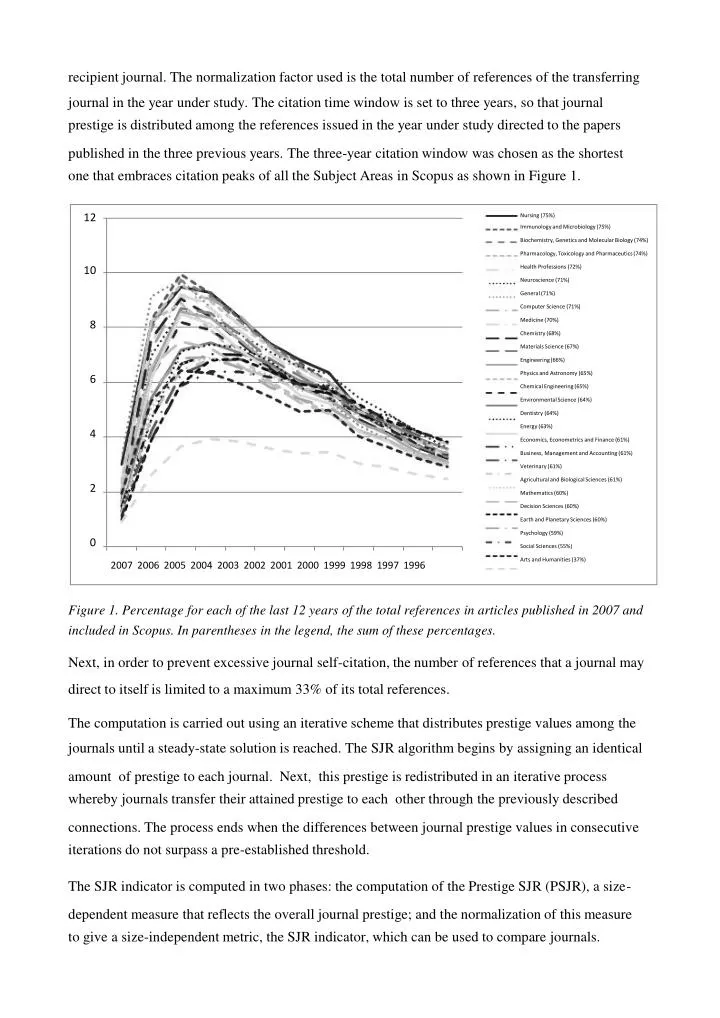
recipient journal. The normalization factor used is the total number of references of the transferring journal in the year under study. The citation time window is set to three years, so that journal prestige is distributed among the references issued in the year under study directed to the papers published in the three previous years. The three-year citation window was chosen as the shortest one that embraces citation peaks of all the Subject Areas in Scopus as shown in Figure 1. 12 10 8 6 4 2 0 Nursing (75%) Immunology and Microbiology (75%) Biochemistry, Genetics and Molecular Biology (74%) Pharmacology, Toxicology and Pharmaceutics (74%) Health Professions (72%) Neuroscience (71%) General (71%) Computer Science (71%) Medicine (70%) Chemistry (68%) Materials Science (67%) Engineering (66%) Physics and Astronomy (65%) Chemical Engineering (65%) Environmental Science (64%) Dentistry (64%) Energy (63%) Economics, Econometrics and Finance (61%) Business, Management and Accounting (61%) Veterinary (61%) Agricultural and Biological Sciences (61%) Mathematics (60%) Decision Sciences (60%) Earth and Planetary Sciences (60%) Psychology (59%) Social Sciences (55%) Arts and Humanities (37%) 2007 2006 2005 2004 2003 2002 2001 2000 1999 1998 1997 1996 Figure 1. Percentage for each of the last 12 years of the total references in articles published in 2007 and included in Scopus. In parentheses in the legend, the sum of these percentages. Next, in order to prevent excessive journal self-citation, the number of references that a journal may direct to itself is limited to a maximum 33% of its total references. The computation is carried out using an iterative scheme that distributes prestige values among the journals until a steady-state solution is reached. The SJR algorithm begins by assigning an identical amount of prestige to each journal. Next, this prestige is redistributed in an iterative process whereby journals transfer their attained prestige to each other through the previously described connections. The process ends when the differences between journal prestige values in consecutive iterations do not surpass a pre-established threshold. The SJR indicator is computed in two phases: the computation of the Prestige SJR (PSJR), a size- dependent measure that reflects the overall journal prestige; and the normalization of this measure to give a size-independent metric, the SJR indicator, which can be used to compare journals.