Download
1 / 1
30 likes | 193 Views
Homoazeotropic Distillation of Maximum Azeotropes in a Batch Rectifier with Continuous Entrainer Feeding: I. Feasibility Studies. P. Lang, G. Modla, B. Benadda 1 , Z. Lelkes Budapest University of Technology and Economics, Hungary, 1 INSA-Lyon LAEPSI, France.

E N D
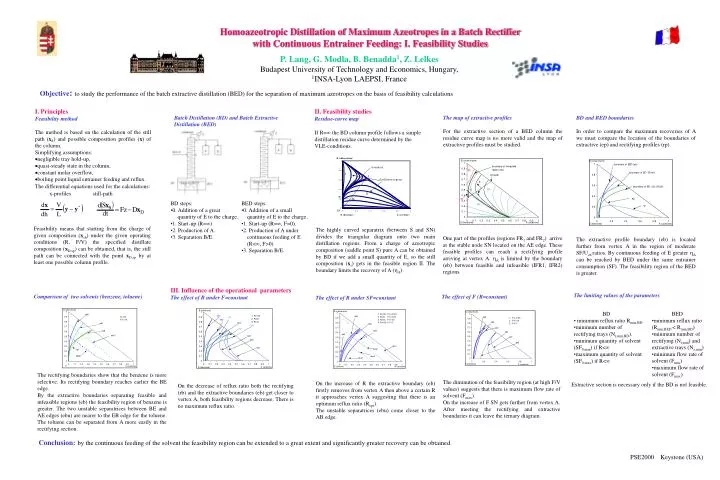
Homoazeotropic Distillation of Maximum Azeotropes in a Batch Rectifier • with Continuous Entrainer Feeding: I. Feasibility Studies P. Lang, G. Modla, B. Benadda1, Z. Lelkes Budapest University of Technology and Economics, Hungary, 1INSA-Lyon LAEPSI, France • Objective: to study the performance of the batch extractive distillation (BED) for the separation of maximum azeotropes on the basis of feasibility calculations Batch Distillation (BD) and Batch Extractive Distillation (BED) II. Feasibility studies Residue-curve map If R= the BD column profile follows a simple distillation residue curve determined by the VLE-conditions. The map of extractive profiles For the extractive section of a BED column the residue curve map is no more valid and the map of extractive profiles must be studied. BD and BED boundaries In order to compare the maximum recoveries of A we must compare the location of the boundaries of extractive (ep) and rectifying profiles (rp). • I. Principles • Feasibility method • The method is based on the calculation of the still path (xS) and possible composition profiles (x) of the column. • Simplifying assumptions: • negligible tray hold-up, • quasi-steady state in the column, • constant molar overflow, • boiling point liquid entrainer feeding and reflux. • The differential equations used for the calculations: • x-profiles still-path • BD steps: • 0. Addition of a great • quantity of E to the charge. • 1. Start-up (R=) • 2. Production of A. • 3. Separation B/E. • BED steps: • 0. Addition of a small • quantity of E to the charge. • 1. Start-up (R=, F=0). • 2. Production of A under • continuous feeding of E • (R<, F>0) • 3. Separation B/E. Feasibility means that starting from the charge of given composition (xch) under the given operating conditions (R, F/V) the specified distillate composition (xD,sp) can be obtained, that is, the still path can be connected with the point xD,sp by at least one possible column profile. The highly curved separatrix (between S and SN) divides the triangular diagram onto two main distillation regions. From a charge of azeotropic composition (saddle point S) pure A can be obtained by BD if we add a small quantity of E, so the still composition (xs) gets in the feasible region II. The boundary limits the recovery of A (A). One part of the profiles (regions FR1 and FR2) arrive at the stable node SN located on the AE edge. These feasible profiles can reach a rectifying profile arriving at vertex A. A is limited by the boundary (eb) between feasible and infeasible (IFR1, IFR2) regions. The extractive profile boundary (eb) is located further from vertex A in the region of moderate SF/Uch ratios. By continuous feeding of E greater A can be reached by BED under the same entrainer consumption (SF). The feasibility region of the BED is greater. The limiting values of the parameters Comparison of two solvents (benzene, toluene) III. Influence of the operational parameters The effect of R under F=constant The effect of F (R=constant) The effect of R under SF=constant • BD • minimum reflux ratio Rmin,BD. • minimum number of rectifying trays (Nr,min,BD). • minimum quantity of solvent (SF0,min) if R< • maximum quantity of solvent (SF0,max) if R< • BED • minimum reflux ratio (Rmin,BED < Rmin,BD) • minimum number of rectifying (Nr,min) and extractive trays (Ne,min) • minimum flow rate of solvent (Fmin) • maximum flow rate of solvent (Fmax) The rectifying boundaries show that the benzene is more selective. Its rectifying boundary reaches earlier the BE edge. By the extractive boundaries separating feasible and infeasible regions (eb) the feasibility region of benzene is greater. The two unstable separatrices between BE and AE edges (ebu) are nearer to the EB edge for the toluene. The toluene can be separated from A more easily in the rectifying section. The diminution of the feasibility region (at high F/V values) suggests that there is maximum flow rate of solvent (Fmax). On the increase of F SN gets further from vertex A. After meeting the rectifying and extractive boundaries it can leave the ternary diagram. On the increase of R the extractive boundary (eb) firstly removes from vertex A then above a certain R it approaches vertex A suggesting that there is an optimum reflux ratio (Ropt). The unstable separatrices (ebu) come closer to the AB edge. Extractive section is necessary only if the BD is not feasible. On the decrease of reflux ratio both the rectifying (rb) and the extractive boundaries (eb) get closer to vertex A, both feasibility regions decrease. There is no maximum reflux ratio. Conclusion:by the continuous feeding of the solvent the feasibility region can be extended to a great extent and significantly greater recovery can be obtained. PSE2000 Keystone (USA)