Download
1 / 33
330 likes | 481 Views
THE REPUBLIC OF SOUTH AFRICA . Investor Presentation April 2013 . Table of contents . Slide. 1 ) South African proposition 4. 2 ) Macro economic developments 6. 3 ) Public finance 13. 4 ) Financing of borrowing requirement 20.

E N D
THE REPUBLIC OF SOUTH AFRICA Investor Presentation April 2013
Table of contents • Slide 1) South African proposition 4 2) Macro economic developments 6 3) Public finance 13 4) Financing of borrowing requirement 20 5) Monetary policy 25 6) Banking stability 31
Key highlights • Domestic growth positive, albeit at a relatively low level • Public sector continues to play a pivotal role in rolling out the long-term infrastructure build programme, particularly with regard to energy and logistical infrastructure • A disciplined spending trajectory and improved growth to ensure sustainability of public finances • Expenditure review to increase efficiency of spending • Tax review commissioned • Long-term fiscal report • While global economic environment remains uncertain, emerging markets and developing countries supportive • Monetary policy stance has been supportive of growth • The NDP setting out an integrated strategy for accelerating growth, eliminating poverty and reducing inequality and proposes mechanisms to change the structure of the economy
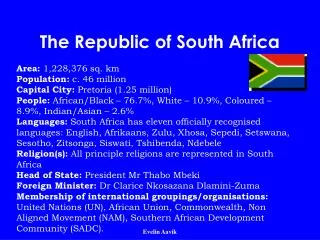
South Africa’s value proposition • Stable macroeconomic environment • Strong institutions, including the Treasury and Central Bank • High quality of production for high value goods • Proximity to regional markets • Government support for manufacturing sector • Protection of property rights • Strong business infrastructure • The credibility of the sovereign in foreign markets • Attractive bond yields • Credible fiscal stance • The depth of domestic financial market and sophistication of the stock market • Strong capitalisation of firms listed on the JSE • Strong legal system and accounting institutions • Good long term growth prospects
Growth outcome in 2012 • GDP growth of 2.5% recorded in 2012 • The primary sector was the most affected in the period in 2012 GDP and its sectoral components • Solid growth in the tertiary (services) sector • Moderate growth in manufacturing and agriculture • Lower production in mining driven by extended periods of strike action Source: SA National Treasury
Shifting trade patterns Mapping South Africa’s exports,2012 • South Africa’s trade patterns have changed in line with global growth trends • Emerging Markets and Africa’s share in South Africa’s export basket is rising: • exports to China increased to 11.6% in 2012 (averaged 4.2% between 2005-2008) • Southern African Development Community absorbed 13% of South Africa’s total exports over the past year (largely driven by manufacturing) • share of exports to the European Union declined from 33% in 2005 to 20.5% in 2012 • almost a quarter of manufactured exports destined to SADC Region/Country Share of Exports (%) Main Products (%) Automobiles (25.8) Platinum (6.6) Rhodium( 3.7) Palladium (5.2) Purifying Machinery (8.6) Platinum (7.2) Coal (6.3) Automobiles (5.5) Petroleum carbons (4.4) Diesel trucks (3.2) Electrical energy (2.2) Iron ore(47) Coal (11.2) Chromium ores (7.7) Ferro-chromium (6.8) Platinum (35.3) Iron ore (13) Aluminium (4.7) Ferro-chromium (5) Source: SA National Treasury
Current account Components of the quarterly current account deficit (% of GDP), 2009-12 • Mining disruptions visible in external trade activity • Infrastructure related machinery and equipment driving imports • Trade balance moved from a surplus of 0.6% in 2011 to a deficit of 2.4% in 2012 • SACU payments doubled from 0.5% of GDP in 2011 to 1% in 2012 • Current account widened to -5.9% of GDP in 2012 from -3.4% in 2011 Trade deterioration Source: Reserve Bank * For first 10 months of 2012
Medium term economic outlook • Growth reaches 2.7% in 2013, before rising to 3.5% in 2014 and 3.8% in 2015 • Headline consumer inflation averages within the 3-6% target range • Current account deficit to average 6.2% over the MTEF as import demand rises • Slower growth results in moderate employment gains Macroeconomic performance and projections, 2009 -2015 Source: SA National Treasury
Consolidated fiscal framework • Budget deficit for 2012/13 revised upwards to 5.2% at the time of the budget • Deficit narrows to 3.1% of GDP by 2015/16 as economic growth gains traction • Primary balance to improve to 0.4% by 2015/16 Consolidated fiscal framework , 2009/10 –2015/16 Source: SA National Treasury
Tax revenue outcomes Revenue surprises on the upside • 2012/13 revenue outcome R 4 billion higher than revised estimate published in Budget 2013 due to: • Steady growth in CIT driven by the services sectors • Healthy growth in domestic and import VAT • Growth in compensation of employees • With the higher revenue and anticipated lower expenditure • fiscal deficit in 2012/13 is likely to be lower than the Budget 2013 estimate (5.2%) Tax Revenue collections 2012/13 Source: SA National Treasury
Revenue outlook Revenue outlook • Revenue-to-GDP is projected to rise over the medium term Tax system review • A commission to be set up for tax review, an ex-judge already appointed to head the commission • Tax system to be reviewed for its impact on employment and fiscal sustainability • Ability to support long-term policy objectives, including those set out in the NDP and faster economic growth Revenue composition, 2005/06-2015/16 Source: SA National Treasury
Expenditure growth slowing • Real annual non-interest expenditure growth of 2.3% in the 3-year framework, compared with 2.9% at the time of the 2012 MTBPS • Government has: • Trimmed growth in national department expenditure • Reduced the contingency reserve by R23.5bn • Reprioritised R52.1 billion in support of key priorities • Core spending is reduced by R10.4bn over the medium term • Expenditure reviews to increase the efficiency of spending and eliminate waste Slower growth in real expenditure Source: SA National Treasury
Composition of public spending • Compensation set to fall as a share of allocated expenditure, while capital rises • Improved certainty on compensation budget due to multi-year wage agreement • Over the long term, declining debt-service costs allows a greater share of resources to be allocated to productive investment and social priorities Average real growth in expenditure, 2008/09 – 2015/16 Composition of government spending, 2011/12 – 2015/16 Source: SA National Treasury
Spending projections on infrastructure Public-sector infrastructure expenditure by area of responsibility, 2011/12 – 2015/16 Source: SA National Treasury
Findings on long term fiscal trends • Projects expenditure trends over the next 15-25 years based on demographic and economic trends: • Current fiscal policy and spending mix is sustainable, but would remain vulnerable unless government rebuilds fiscal space • Pressure that social grants place on the fiscus will begin to decline over the next decade • Government spending on health will continue to rise as a share of GDP in coming decades, even without reforms. • As the school-age population begins to decline, resource pressures on the basic education sector will ease • New projects like National Health Insurance will require much faster growth, expenditure shifts, or increases in taxes
Net borrowing requirement Financing of national government net borrowing requirement, 2011/12 – 2015/16 • Funding to be raised largely from domestic bond market • Net borrowing requirement to moderate to R152 bn in 2015/16 • About $4.5 bn to be borrowed in the international market over the medium term • Weekly bond auction amount increased to R2.35 bn in 2013/14 • Loan redemption projected to R113 bn over the medium term Source: SA National Treasury
Debt level to peak in 2015/16 • Debt levels more than doubled since the 2008 financial crisis • Net loan debt to reach R1.7 trillion in 2015/16 • As percentage of GDP net loan debt is expected peak at 40.3% in 2015/16 Total national government debt,1 2009/10 – 2015/16 Source: SA National Treasury
Debt maturity profile of government • Active management of refinancing risks • Average term-to-maturity extended to13 years • Cash accumulation to deal with short-term refinancing Financing of national government net borrowing requirement, 2011/12 – 2015/16 Source: SA National Treasury
Holdings of domestic government bonds Holdings of domestic government bonds (%) , 2007 – March 2013 • Non-residents supporting domestic government bonds • non-residents holdings reached a record high of 38% (R366bn) in March 2013 following the inclusion in the World Government Bond Index • attributed to global liquidity and attractive yield differential • Local pension funds remain underweight bonds • Holdings by banks relatively flat Source: Share Transaction Totally Electronic LTD(Strate)
Inflation profile Underlying measures of inflation • Headline inflation has trended higher but is expected to remain contained within target range, barring a temporary breach in 3Q2013 • Core inflation does not indicate any significant demand pressures • Headline inflation is expected to average 5.9 per cent in 2013 and 5.3 per cent in 2014 Source: SARB,QB March 2013
Balance of payments Balance of payments: Overall balance Financial account Source: SARB,QB March 2013
ZAR exchange rate • The ZAR has decoupled from other emerging market currencies and the VIX index, reflecting domestic factors. • On a trade-weighted basis, the ZAR has depreciated by over 5 per cent in the year to 4 April, and by 7.5 per cent against the USD. Exchange rate movement Source: Bloomberg
Growth in employment and output Wage and employment growth • Wage settlements also pose an upside risk to inflation outlook and could have negative implications for employment growth • Domestic growth prospects remain subdued, with the balance of risks tilted to the downside • Consumer demand is constrained by slower growth in disposable income and rising inflation Gross domestic product versus expenditure Source: SARB, QB March 2013
Monetary policy stance Nominal and real purchase rate • Monetary policy remains accommodative, while real interest rates have been in negative territory since late 2012 • The current monetary policy stance is deemed appropriate given the absence of any significant demand driven inflationary pressures and the existence of a negative output gap Source: SARB, QB March 2013
Sound and stable banking system Total assets and gross loans and advances • Total assets and gross loans and advances of the banking sector are growing at healthy levels • South African banking sector remained adequately capitalised • Banks continued to post healthy profitability numbers supported by generally improved quality of assets • Although still growing, the sector’s total unsecured gross credit exposure remained only about 10% of total gross credit exposure • Credit exposure to counterparties with legal jurisdiction in GIIPS remained insignificant • Proposed amended Regulations Relating to Banks were published in August 2012 Selected indicators of SA banks (Dec 2012) Source: SARB, December 2012. * June 2012
Banking sector efficiency • The cost-to-income ratio increased to above 50% in Sept 2009 to reach a peak of about 57% in June 2011; it has been declining steadily since then • The growth rate in total expenses exceeded the growth rate in total income from November 2009 to November 2011 • By focusing on reducing operating expenses and targeting profitable areas: • the ratio of growth in total income to growth in total expenses (jaws ratio) has been in positive territory since December 2011 Cost-to-income ratio and jaws ratio Source: SARB
Disclaimer This presentation has been prepared by the National Treasury, Republic of South Africa (the “National Treasury”) solely for information purposes. No representation or warranty express or implied is made to, and no reliance should be placed on, the fairness, accuracy, completeness or correctness of the information or any opinion contained herein. The information contained in this presentation should be considered in the context of the circumstances prevailing at the time and will not be updated to reflect material developments that may occur after the date of the presentation. Neither the National Treasury nor any of its affiliates officers, directors or advisors shall have any liability whatsoever (in negligence or otherwise) for any loss arising from any use of this presentation or its contents or otherwise arising in connection with this presentation. This presentation is being communicated only to persons who have professional experience in matters relating to investments and to persons to whom it may be lawful to communicate it. By reviewing this presentation you represent and agree that you and any customers you represent are: (a) a qualified institutional buyer (within the meaning of Regulation 144A under the U.S. Securities Act of 1933, as amended (the “Securities Act”); or (b) not a U.S. person and are outside of the United States and not acting for the benefit of a U.S. person. (as defined in Regulation S under the Securities Act). This presentation does not constitute or form part of an offer, invitation or recommendation to purchase or subscribe for any securities and no part of it shall form the basis of or be relied upon in connection with any contract, commitment or investment decision in relation to any securities. No money securities or other consideration is being solicited, and, if sent in response to this presentation or the information contained herein, will not be accepted. The presentation may contain statements that reflect the National Treasury’s beliefs and expectations about the future. These forward looking statements are based on a number of assumptions about the future, some of which are beyond the National Treasury’s control. Such forward-looking statements are subject to certain risks and uncertainties that could cause actual results to differ materially from those contemplated by the relevant forward-looking statements to reflect events that occur or circumstances that arise after the date of this presentation. Certain data in this presentation was obtained from various external data sources, and the National Treasury has not verified such data with independent sources. Accordingly, the National Treasury makes no representations as to the accuracies or completeness of that data, and such data involves risks and uncertainties and is subject to change based on various factors. You agree to keep the contents of this presentation strictly confidential. All or any part of this presentation may not be taken way, reproduced, redistributed or retransmitted in any manner. By attending this presentation you are agreeing to be bound by the foregoing limitations.