Download

1 / 30
310 likes | 567 Views
Fixed Income Portfolio Management. Professor Paul Bolster Northeastern University Boston, Massachusetts USA. Fixed Income Portfolio Management. What is fixed income? Valuation of fixed income securities Sources of risk in fixed income portfolios

E N D
Fixed Income Portfolio Management Professor Paul Bolster Northeastern University Boston, Massachusetts USA
Fixed Income Portfolio Management • What is fixed income? • Valuation of fixed income securities • Sources of risk in fixed income portfolios • Passive, active, and other management strategies
What is fixed income? • “Fixed income” refers to all securities that provide (or promise to provide) contractual payments during their lifetime. Fixed income securities often make regular payments of interest. • Bonds, Notes, some money market instruments • Some variable-interest instruments are classified as fixed income
Bonds – Basic Features • Contract: interest, par, maturity • Senior or Junior claim? • Collateral or Debenture • Sinking Fund • Call (or Put) feature • Conversion feature • Other types (floating rate, ZCB,…)
Bond Ratings • Assessment of creditworthiness • Issues are rated, not firms • Ratings agencies • Investment grade vs. Junk • Ratings changes and value
Bond Ratings – S&P Outline • Industry Analysis • Industry Risk • Market Position • Operating Efficiency • Management Evaluation • Financial Analysis • Earnings Protection • Financial Leverage and asset protection • Cash flow adequacy • Financial flexibility • Accounting quality
Bond Rating • Springfield debt downgraded to junk-bond status (Boston Globe, June 3, 2004) • “only 2 percent of cities nationwide are considered to be such a risky investment. The move by Standard & Poor's puts Springfield in the company of such downtrodden economically burdened cities as Camden, N.J.; Troy, N.Y.; Cranston, R.I.; and Pittsburgh”
One year transition matrix From\ToAaa Aa A Baa Ba B C&D Aaa 91.9 7.38 0.72 0 0 0 0 Aa 1.1 91.3 7.1 0.3 0.2 0 0 A 0.1 2.6 91.2 5.3 0.6 0.2 0 Baa 0 0.2 5.4 87.9 5.5 0.8 0.2
Bond Valuation • Present value! • Assume cash flows are known, adjust for risk in the required return (or Yield-to-Maturity) • Example: • ATT 6s 10 (as listed on the NY Bond Exch.) • Par value = $1,000; Matures: Oct. 15, 2011 • Semiannual coupon=(6% of $1,000)/2=$30 • Payments: April 15, October 15
Bond Valuation Example • Assumes valuation on October 15, 2004
Bond Valuation • What is the Yield to Maturity (YTM)? • Assumes: • No default • Bond held to maturity • Coupons reinvested at the YTM • It’s the “promised” yield based on current market value • Contrast with alternatives: • Current Yield • Yield to Call • Realized Yield (or Horizon Yield)
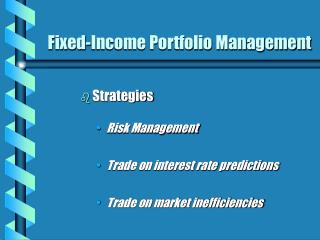
Sources of risk in fixed income portfolios • Interest rate risk • If interest rates change, all bonds are affected • More important for bonds with high credit ratings • Default risk • If the economy improves/worsens, all bonds are affected • More important for bonds that are speculative in nature • Captured by bond rating
Interest Rate Risk – Bond Pricing Theorems • Bond prices and yields vary inversely - recall example on previous slide • Long term bonds are more sensitive to i-rate changes than short term bonds • ex. A B C • Coupon ($) 90 90 90 • Face Value 1,000 1,000 1,000 • Moody's Rating Aa Aa Aa • Term-to-maturity 5 yrs. 10 yrs. 15 yrs. • YTM 9% 10% 11% • Price 1,000 939 856 • Let yields decrease by 10% (8.1%, 9%, and 9.9% respectively). • New prices are: 1,036 1,000 931 • %Price change: 3.6% 6.6% 8.8%
Interest Rate Risk – Bond Pricing Theorems 3. Bond price sensitivity increases at a decreasing rate as maturity approaches ex. See previous slide. The price change for B is 3% higher than A, but the price change for C is only 2.2% higher than B. • Bond prices are more sensitive to a decline in i-rates than a rise in i-rates • Let yields increase by 10% (9.9%, 11%, 12.1% respectively). • New prices are: 966 882 790 • %Price changes: -3.4% -6.1% -7.7% • Compare these price changes with the ones resulting from a decline in i-rates provided above.
Interest Rate Risk – Bond Pricing Theorems • Low coupon bond prices are more sensitive to i-rate changes than high coupon bond prices • ex. A B • Coupon ($) 60 100 • Face Value 1,000 1,000 • Moody's Rating Aa Aa • Term-to-maturity 10 yrs. 10 yrs. • YTM 12% 12% • Price 661 887 • Let yields decrease to 11%. • New prices are: 706 942 • %price changes: 6.7% 6.2% • Prices are more sensitive when i-rates are low than when they are high.
Duration • Maturity is imperfect measure of short term or long term nature of bond • need to take into account effect of coupons • compute average: “effective maturity” • (Macaulay) duration: weighted average of cash-flow times, with weight of date (t) proportional to cash-flow (CFt) present value:
Example of Duration Calculation Year t Coupon PV coupon t*PV 2004 1 30 28.89616644 28.89616644 2004.5 2 30 27.83294783 55.66589567 2005 3 30 26.80884977 80.42654932 2005.5 4 30 25.82243284 103.2897314 2006 5 30 24.87231057 124.3615529 2006.5 6 30 23.95714754 143.7428852 2007 7 30 23.07565743 161.529602 2007.5 8 30 22.22660126 177.8128101 2008 9 30 21.40878565 192.6790708 2008.5 10 30 20.62106111 206.2106111 2009 11 30 19.86232047 218.4855252 2009.5 12 30 19.13149727 229.5779673 2010 13 30 18.42756432 239.5583361 2010.5 14 1030 609.4006051 8531.608471 Sum 912.3439476 10493.84517
Duration Calculation - Continued A. Sum of Time Weighted Cash Flows 10493.84517 B. Sum of PVs of Cash Flows (or Price) 912.3439476 C. Macauley’s Duration = A/B = 11.50 semiannual periods 5.75 years D. Modified Duration = C/(1+YTM/2) = 5.54 years Interpretation? The slope of the Price-Yield function is about -5.54. Therefore, a 1% change in bond yield will produce approximately a 5.54% change in bond price. (Why approximately?) This version of duration assumes a flat term structure.
Convexity • Duration is a linear estimate of the bond’s price-yield function at a specific point. (it is the first derivative) • The price-yield function is convex. • In our example, convexity = 149.32
Duration and Convexity: Assumptions • Derivation and application of duration and convexity assumes: • Term structure is flat • Shifts are parallel • Bonds have no imbedded options • Relaxing the last assumption: • How does a call option influence the price-yield relationship? • A put option? (Mortgage backed securities)
Fixed Income Portfolio Management Strategies • Passive or Active? • Passive: • Not trying to “beat the market” • Attempts to control risk of the portfolio • Indexation • Immunization
Fixed Income Portfolio Management - Passive • Indexation • Build a portfolio that replicates an observable index • High-grade: Salomon Brothers, Lehman Brothers • High-yield: Credit Suisse First Boston • Problems: Numerous index components, liquidity is low for many, bonds mature • Solution: Cell approach • Manager: How do you beat an index? • Investor: How do you evaluate effectiveness?
Fixed Income Portfolio Management - Passive • Immunization • Manage or protect portfolio value from changes in interest rates • Net Worth Immunization • Banks frequently have short-term liabilities (deposits) and long-term assets (loans). • Asset Duration > Liability Duration • Objective is to minimize the inequality • Adjustable rate contracts • Resale of loans, such as mortgages, to a third party • Use interest rate futures or other derivatives
Fixed Income Portfolio Management - Passive • Target Date Immunization • Objective is to guarantee a specific value at a specific point in time. • Often used to match an asset’s future value with a future liability • Interest rate risk can be divided into price risk and reinvestment rate risk. How are these risks related? • If portfolio duration is equal to planned holding period, then the portfolio is immunized
Fixed Income Portfolio Management - Passive • Example of Immunization • A pension fund has a fixed liability of $1 million due in 5 years. Two bonds are available to build a portfolio that matches the liability’s duration • Bond A: 9% coupon, 5 years to maturity, D = 4.26 years • Bond B: 8% coupon, 8 years to maturity, D = 6.21 years • To generate a portfolio with a duration of 5 years, we must determine WA and WB. YTMA = YTMB = 8%Since WB = 1 - WA , (WA )(DA ) + (1 - WA )(DB ) = H, where H is the holding period or duration of the liability. • Solving for WA , WA = (H - DB ) / (DA - DB ) . • So the initial position should be 61.8% A and 38.2% B.
Immunization Example - continued • One year passes, interest rates have fallen from 8% to 7%. DL = 4 • DA = 3.54 DB = 5.62 • Duration does not decline at the same rate as time to maturity! (Except for ZCBs) • An immunization strategy is not purely passive. Must periodically rebalance: • New weights for A and B: 77.9%, 22.1%
Fixed Income Portfolio Management - Active • Active management presumes that the manager can generate a positive a (or provide a positive risk-adjusted return) • Swaps: • Exchanging one bond for another in anticipation of a change in the relative prices of the bonds
Fixed Income Portfolio Management - Active • Examples of bond swaps: • Substitution swap: exchanging one bond for another to exploit pricing discrepancies • Intermarket spread swap: yield spread between 2 market segments is too wide or too narrow • Rate anticipation swap: move toward higher/lower D portfolio depending on i-rate forecasts • Pure yield pickup swap: buy higher yield bonds and sell lower yield bonds (increase in risk)
Fixed Income Portfolio Management - Active • Riding the yield curve: • If YC is upward sloping and expected to stay that way, buy and hold. As maturity declines, yields decline and contribute to capital gains. • Ex: Buy 9-month t-bills with yield of 1.5% per quarter • Price = $10,000/(1.015)3 = $9,563.17 • Hold for 6 months. If yields now at 0.75% per quarter, Price = $10,000/(1.0075) = $9,925.56 • Return = 1.88% per quarter • What is the risk of this strategy?
Fixed Income Portfolio Management – Other issues • Barbelled or laddered? • Barbelled portfolio: buy a larger amount of ST and LT bonds with smaller allocation to middle maturities • Laddered portfolio: buy equal amounts across a range of maturities • Why is this a bet on interest rates?