Download
1 / 27
270 likes | 420 Views
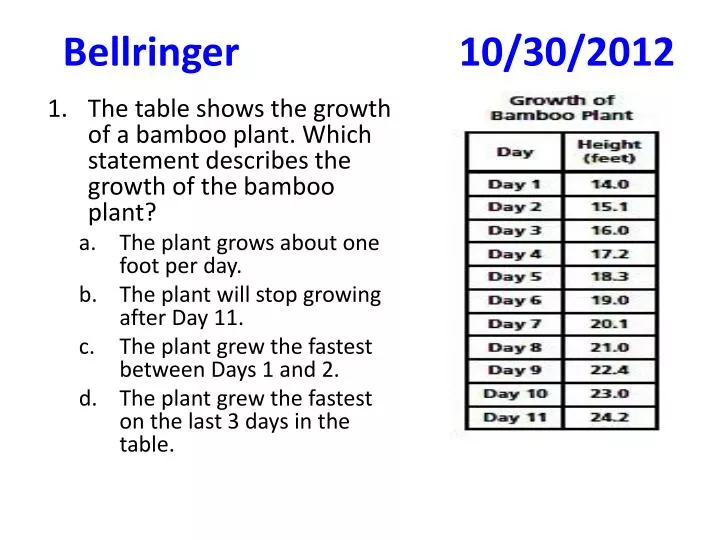
Bellringer 10/30/2012. The table shows the growth of a bamboo plant. Which statement describes the growth of the bamboo plant? The plant grows about one foot per day. The plant will stop growing after Day 11. The plant grew the fastest between Days 1 and 2.

E N D
Bellringer 10/30/2012 • The table shows the growth of a bamboo plant. Which statement describes the growth of the bamboo plant? • The plant grows about one foot per day. • The plant will stop growing after Day 11. • The plant grew the fastest between Days 1 and 2. • The plant grew the fastest on the last 3 days in the table.
Let’s Begin our notes! • When we take our notes: • There will be NO talking. • If it is in red, we write it down. • Mr. Vo should see all pencils moving across the paper, all mouths closed, all backs straight in the desks.
Achievers ROAD Check • What is a table? • Why do scientists use tables? • What are some common trends?
There are 3 main types of graphs in science. • A line graph (2)shows changes over time. • A bar graph (3)shows how two groups compare to each other.
There are 3 main types of graphs in science. • A pie chart (4)is used to show percentages or data as “part of a whole”
The x-axis(5) lies down, the y-axis(6)stands up. Always understand what your graph’s axes are comparing. Book Smarts Money earned Books Read Basketball Skillz
Label your graphs! Title Title Dependent variable y - axis x - axis Independent variable
A scientist studied 160 bird eggs and counted the number of eggs in each nest. Approximately, how many nests contained 4 or more eggs? A. 55 B. 80 C. 97 D. 115 ROAD CHECK
A scientist studied 160 bird eggs and counted the number of eggs in each nest. Approximately, how many nests contained 4 or more eggs? A. 55 B. 80 C. 97 D. 115 ROAD CHECK
What 2 things are we comparing? Amount of time spent outside __________ ____________ Hours of TV watched
Independent vs. Dependent Variables • Independent variables: the part of the experiment that (7)I can change, that (8)I have control over. • The (9)manipulated variable • Dependent variable: the part of the experiment that (10)responds to what I have changed • The (11)respondingvariable
Bar Graphs • Used for data that is (12)categorized or grouped • x-axis is (13) notordered • y-axis is usually a (14)percentage, frequency, or whole number Example:
Line Graphs • Used to show how the (15)dependent variable changes in response to the (16)independent variable • Points on the line graph are (17)connectedbecause the values (18)(numbers) from each observation (19)dependson the values from the one before it
Pie Graphs • Used to show(20)percentages or data as (21)“parts of a whole.”
(22)To read a graph, draw a line UP from your x-axis and ACROSS from your y-axis. Money earned Basketball Skill Level
The More Education, the More Income Weekly Earnings $$$ Education After Middle School
What is the dependent variable?________________________ • What is the independent variable?_______________________ • What can you conclude from this? _________________________________________________________________________________________________
Student Heights in Mr. Vo’s _____ Period Class # of Students Height in Inches
What is the dependent variable?________________________ • What is the independent variable?_______________________ • What can you conclude from this? _________________________________________________________________________________________________