Download
1 / 8
100 likes | 256 Views
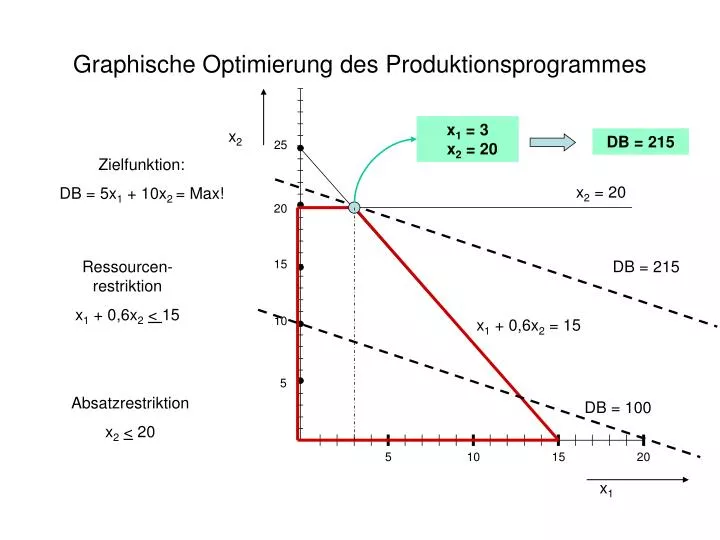
x 1 = 3 x 2 = 20. x 2. 25. x 2 = 20. 20. 15. 10. x 1 + 0,6x 2 = 15. 5. 5. 10. 15. 20. x 1. Graphische Optimierung des Produktionsprogrammes. DB = 215. Zielfunktion: DB = 5x 1 + 10x 2 = Max!. Ressourcen-restriktion x 1 + 0,6x 2 < 15. DB = 215. Absatzrestriktion

E N D
x1 = 3 x2 = 20 x2 25 x2 = 20 20 15 10 x1 + 0,6x2 = 15 5 5 10 15 20 x1 Graphische Optimierung des Produktionsprogrammes DB = 215 Zielfunktion: DB = 5x1 + 10x2 = Max! Ressourcen-restriktion x1 + 0,6x2< 15 DB = 215 Absatzrestriktion x2< 20 DB = 100
(4) (3) FS2 FS7 (3) (4) (5) (6) (3) FS1 FS3 FS5 FS8 FS10 (3) (4) (5) FS4 FS6 FS9 (4) Operationszeit je Fertigungsstelle FSx Fertigungsstelle(Arbeitselement) Vorrangbeziehung Prozessplanung mit Vorranggraph
A1 A2 A3 A1 A3 A2 A2 A1 A3 A2 A3 A1 A3 A1 A2 A3 A2 A1 Optimale Produktionsreihenfolge ?
1 2 3 4 5 6 7 8 9 10 11 12 13 14 15 16 17 18 A1 FS1 FS2 Ziel 12h A2 10h A3 11h A1 FS1 FS2 A3 A2 A2 FS1 A1 FS2 A3 A2 FS1 A3 FS2 A1 A3 FS1 FS2 A1 A2 A3 FS1 FS2 A2 A1 Optimale Produktionsreihenfolge
FS1 FS1 FS1 FS1 FS2 FS1 1 2 3 4 5 6 7 8 9 10 11 12 13 14 15 16 17 18 FS1 A1 A2 A3 FS2 FS2 FS2 FS2 FS2 Maschinenbelegungsplan Optimum
Kapazitäts-belastung (in % der max- Kapazität) Überlast Unteraus-lastung 100 % - Linie Produktionsfluss Kapazitätsprofil eines Produktionsprozesses FS1 FS6 FS7 FS4 FS2 FS8 FS3 FS5 100 % FS = Fertigungsstelle
Kanban-Regeln • Regel 1:Die verbrauchende Stelle darf immer nur die benötigten Teile in der benötigten Menge zum spätest möglichen Zeitpunkt aus dem Pufferlager entnehmen. • Keine Entnahme ohne Kanban • Keine Abweichung der Entnahmemenge von der Kanban-Menge • Kein Produkt ohne zugehörige Kanban-Karte • Regel 2: Die produzierende Stelle darf immer nur genau die Menge der Teile, die aus dem Pufferlager entnommen werden, produzieren. • Keine Abweichung der Produktionsmenge von der Kanbanmenge • Keine Änderung der Ankunftsreihenfolge der Kanbans. Regel 3: Es dürfen keine defekten Teile an den nächsten Prozess weiter gegeben werden. Regel 4: Die Schwankungen im Verbrauch der kanbangesteuerten Teile müssen gering sein. Regel 5: Die Anzahl der Kanban-Karten muss minimiert werden.