Download
1 / 11
110 likes | 263 Views
Oil Production and Consumption. By Joseph Yacomine. How is oil production and consumption geographically distributed today. Notes for the Graph Above. Africa trades the most oil: 329,100,000 tons The next highest trader is Northern Asia It trades 290,800,000 tonnes. Notes for Graph Above.

E N D
Oil Production and Consumption By Joseph Yacomine
How is oil production and consumption geographically distributed today
Notes for the Graph Above • Africa trades the most oil: 329,100,000 tons • The next highest trader is Northern Asia • It trades 290,800,000 tonnes
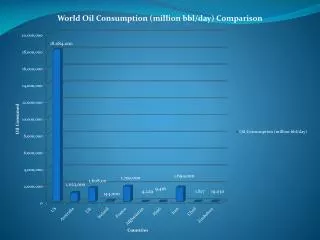
Notes for Graph Above • USA has been the highest oil consumer at ten million barrels per day. By 2010 the number has doubled • The lowest oil consumers on the graph are India and South Korea at 2.5 million barrels per day in 2010
How has oil production and consumption varied in the last 30 years
Notes for Graph Above • The two spike years of oil production increase are 1981 and 2008 • 1981 saw 61 million barrels a day at 65 dollars a barrel and 2008 had 75 million barrels a day at 95 dollars a barrel
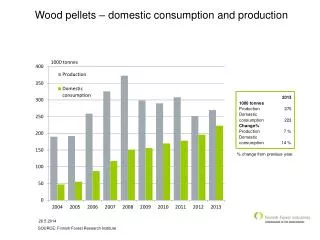
Notes for Graph Above • In 1950 began with 500,000,000 barrels a day • In 1980 oil consumption peaked at 3,000,000,000 barrels a day before having a short decrease until 1985 • There was nothing but an increase after that, reaching 3,800,000,000 barrels a day in 2005
Notes for Graph Above • Industrialized countries have always consumed more oil than developing countries and the Former Soviet Union. • In total, the world consumed approximately 48 million barrels a day in 1970, and by the turn of the century that number had increased to 65 million barrels. It is predicted to reach 120 million barrels by 2020 • It is predicted that developing countries will consume the same amount of oil a day (approximately 40 million barrels) by 2020