Download
1 / 11
110 likes | 179 Views
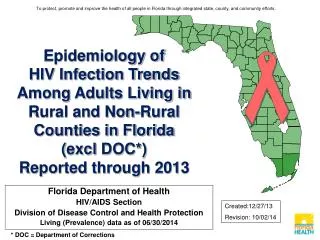
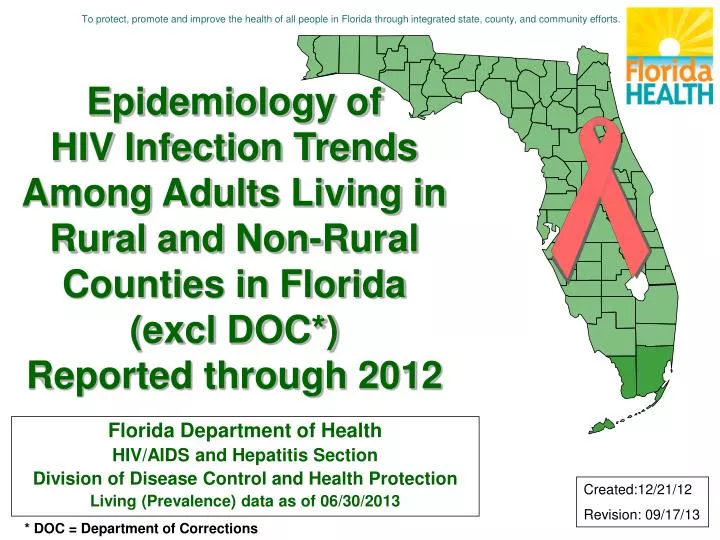
To protect, promote and improve the health of all people in Florida through integrated state, county, and community efforts. Epidemiology of HIV Infection Trends Among Adults Living in Rural and Non-Rural Counties in Florida (excl DOC*) Reported through 2012. Florida Department of Health

E N D
To protect, promote and improve the health of all people in Florida through integrated state, county, and community efforts. Epidemiology of HIV Infection Trends Among Adults Living in Rural and Non-Rural Counties in Florida (excl DOC*) Reported through 2012 Florida Department of Health HIV/AIDS and Hepatitis Section Division of Disease Control and Health Protection Living (Prevalence) data as of 06/30/2013 Created:12/21/12 Revision: 09/17/13 * DOC = Department of Corrections
Cases Living with HIV Disease • Data in these slides represent cases living with HIV Disease, also referred to Persons Living with HIV/AIDS (PLWHAs), who were reported through the most recent calendar year. Living data are also referred as prevalence cases. • HIV prevalence data are generated later in the year, usually in May, when most of the “expected” death data are complete. • Adult cases represent ages 13 and older, pediatric cases are those under the age of 13. For living data, the age is by current age at the end of the most recent calendar year, regardless of age at diagnosis. • Unless otherwise noted, whites are non-Hispanic and blacks are non-Hispanic. • Total statewide data will include Department of Correction Cases (DOC) unless otherwise noted. County data will exclude DOC cases. Thus DOC cases were omitted in this slide set.
Image Source: Florida Department of Health. (2012, December). Rural and Urban Counties, 2010. Office of Rural Health. Retrieved from http://www.doh.state.fl.us/workforce/ruralhealth/PDFs/Rural_Urban_County_Map_2010.pdf as of September 16, 2013.
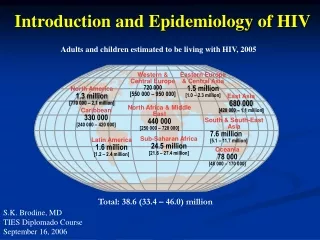
Adults Living with HIV Disease,Among Rural and Non-Rural (Urban) Counties in Florida, Reported through 2012
Adults Living with HIV Disease,Among Rural and Non-Rural (Urban) Counties by Current Age Group, Reported through 2012, Florida Non-Rural N=91,609 Rural N=2,370 Note: There is very little difference in current age between rural and non-rural counties.
Adult Males Living with HIV Disease,Among Rural and Non-Rural (Urban) Counties by Race/Ethnicity, Reported through 2012, Florida Rural N=1,601 Non-Rural N=63,759 Note: Among males living with HIV disease, white males had a higher proportion of the rural cases and white and black males had nearly similar proportions of the non-rural cases. *Other includes Asian/Pacific Islanders, Native Alaskans/American Indians and mixed races
Adult Females Living with HIV Disease,Among Rural and Non-Rural (Urban) Counties by Race/Ethnicity, Reported through 2012, Florida Rural N=769 Non-Rural N=27,850 Note: Blacks are over-represented among adult females living with HIV disease, accounting for 63% of the rural cases and 69% of the non-rural cases. *Other includes Asian/Pacific Islanders, Native Alaskans/American Indians and mixed races.
Adult Males Living with HIV Disease,Among Rural and Non-Rural (Urban) CountiesBy Mode of Exposure, Reported through 2012, Florida Non-Rural N=63,759 Rural N=1,601 Note: NIRs redistributed. Overall, among males living with HIV disease, the distribution of mode of exposure is nearly similar between rural and non-rural counties.
Adult Females Living with HIV Disease,Among Rural and Non-Rural (Urban) CountiesBy Mode of Exposure, Reported through 2012, Florida Non-Rural N=27,850 Rural N=769 Note: NIRs redistributed. Among females living with HIV disease, there is very little difference in mode of exposure between rural and non-rural counties.
Median Survival Time (in months) from AIDS Diagnosis to Death, Rural vs. Non-Rural and Total Deaths for this Period, 2007-2012, Florida Note: These data show that the median survival time for rural cases is about 10 months less than for non-rural. This could be attributed to late diagnosis among rural residence and/or limited access to care in the rural communities. *Source: Florida Department of Health, Bureau of Communicable Diseases, HIV/AIDS Reporting System (as of 06/30/2013)
For Florida HIV/AIDS Surveillance Data Contact: (850) 245-4444 Lorene Maddox, MPH Ext. 2613 Tracina Bush, BSW Ext. 2612 Madgene Moise, MPH Ext. 2373 Visit Florida’s internet site for: Monthly Surveillance Reports Slide Sets and Fact Sheets Annual Reports and Epi Profiles http://www.doh.state.fl.us/disease_ctrl/aids/trends/trends.html Visit CDC’s HIV/AIDS internet site for: Surveillance Reports, fact sheets and slide sets http://www.cdc.gov/hiv/topics/surveillance/resources/reports/index.htm