Download
1 / 42
420 likes | 555 Views
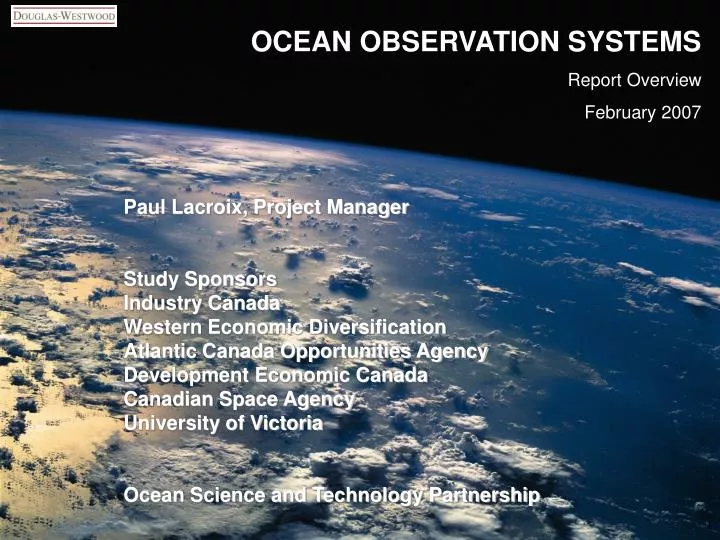
OCEAN OBSERVATION SYSTEMS Report Overview February 2007. Paul Lacroix, Project Manager Study Sponsors Industry Canada Western Economic Diversification Atlantic Canada Opportunities Agency Development Economic Canada Canadian Space Agency University of Victoria

E N D
OCEAN OBSERVATION SYSTEMS Report Overview February 2007 Paul Lacroix, Project Manager Study SponsorsIndustry CanadaWestern Economic DiversificationAtlantic Canada Opportunities Agency Development Economic Canada Canadian Space AgencyUniversity of Victoria Ocean Science and Technology Partnership 1
Introduction The interviews The research The market Canada Conclusions
Objectives Estimate the worldwide OOS market size, segmentation and niche opportunities, derived from an end-user perspective to 2011. Present information on the strategic disciplines expected to need or use OOS, the associated market intelligence for both current technologies and those believed to be used or needed in the near future. Identify issues that will need further study 3
Activities 56 in-depth interviews were conducted across 18 countries Our research has identified 66 organisations worldwide involved with 110 programs. The programs divide into 29 ‘satellite-based’ and 81 ‘ocean-based’ Analysis has identified nearly $2 billion annual spend on OOS worldwide in 2006 Market forecasts developed to 2011 4
Introduction The interviews The research The market Canada Conclusions
The interviews – interviewees and organisations 56 in-depth interviews Senior executive level Decision-making status on a self-scored scale of 1-10 (10 being high) averaged 7.5 86% were either suppliers of products and services to the OOS community or their customer base – the research organisations Most spanned a wide range of application areas 50% (28) were engaged in some aspect of research and 10 maintained an OOS Responsibilities incl: management / coordination of global or regional programs, direction of scientific groups, management of an Antarctic project team Sample interviews undertaken with major users e.g. forecasters & oil majors Interviewees by region 6
The interviews – application areas of organisations work Ocean data & models and weather & climate formed the largest applications – but often difficult to separate Remainder were specific applications The overall picture is of great volumes of data being gathered and being made available either directly or via the results from say weather models OOS objectives / users 7
OOS performance Q11. In current projects you are involved in – do systems perform to specification, or is there room for improvement (in technology, maintenance etc.)? In the main, systems were performing to specification. However, many felt that there was considerable room for improvement “Systems generally perform to spec in short term; longer term maintenance & reliability is yet to be determined and issues will arise” “Improved sensors to measure biochemical variables in sustained way” “Improved system longevity. Reduced drift. Reduced power consumption” A number of the current projects have future phases but……. “There is no clear indication that systems (presently) deployed will actually be maintained in the future” 8
Sources of funding Q17. Who are the principal financing organizations for your ocean observation systems and how easy was it to get funding? • The predominant funding source is national governments, via various federal and other specific agencies. • Funding reported by interviewees, worldwide, to be very difficult to obtain : “Took one and a half years…extremely arduous, frustrating exercise” (Canada) “Government people need lots of convincing that coastal management is important” (Dubai) “Frustrating, but usually forthcoming, particularly when there are issues such as the recent sudden influx of refugees from Africa” (Spain) “Highly political issue, challenge is to get long term sustained funding. ….Simpler in the US were federal system is in place and most funding is from NOAA” (UK) • However, one did note that it was “Not too difficult with a well thought out business plan” 9
Technology – users wish list Q17 cont. In your view, what kind of technology will be required and developed in the coming years? Views were grouped into a ‘wish list’, mainly focussed in five areas: • Reduced costs and improved reliability • More autonomous platforms to reduce cost • Arctic systems (under-ice AUVs & sensors) • Sensors – improved reliability & costs – chemical & biosensors development – acoustic telemetry • Data transmission, management & computing – need for improvements in all aspects • Space systems – sensor development 10
Key drivers Q18. What factors and situations are driving the development of the industry? • Environmental issues lead. Probably due to: • Increasing public awareness of the issues of global warming and climate change and the role of the oceans in this subject • The political response • Pollution monitoring distinct issue • Commercial factors driving suppliers (e.g. serving equity financing) • Increasing regulations to be met, from corporate safety to environmental law. • Tsunami warning received such a low score (perhaps a public survey would have produced more) 11
Improvements or developments needed Q19. What improvements or developments do you feel are required to support the integration of space-based and in-situ observations? Subject is complex, many factors in play, including the need for : • Cooperation between the different agencies and organisations • More cooperation between the two communities • Funding for research and implementation, including development of coupled models • Free or cheap access to data • Open sourced data storage and retrieval to better support the concept of ‘collect data once, use many times’ • Address technical problems (from low data rates to low resolution satellite sensors) • Better data transmission • National standard or a governing body to implement standards and approved methods/technologies for data integration. “A very important point and a core issue at international level” “US-based Lockheed Martin contract from NOOA for conceptual designs for the Integrated Ocean Observing System (IOOS)” 12
OOS standards are needed Q 20. Are a set of ocean observing system standards needed? If yes, what form would they take and should they include? • Very strong supportfor this concept • Form & inclusion produced a wide range of ideas and comments from: • Overall QA • Standards needed across the board: sensors, buoys, data gathering, transmission, storage & archiving “The oceanographic industry has been slow in developing standards, it’s our Achilles heel” “There are several standards already. If anything, a single standard could be chosen from existing ones” “NOAA will be the lead” 13
Required improvements Q 21. In your experience of ocean observing systems, what improvements are required? It is the basics that are still in need of improvement “Improved reliability requires improved corrosion and bio-fouling control, and maintaining very long calibration accuracies” Responses focussed in four areas: • 33 – sensors on surface buoys • 3 – meteorological data gathering • 3 – coastal zone observations • 3 – oceanographic sensors for subsurface moorings Individual responses: • 6 –better anti-fouling products • 4 –better telemetry and data transmission • 5 – improved sensors for nutrients and biological characteristics • 3 –improved sensors for nutrients and biological characteristics 14
Impediments to progress Q 22. What do you view as the impediments to progress in ocean observing? 30% – access to stable long-term funding dominates 15% – lack of government awareness of the significant benefits of observational and operational oceanography. 7% – lack of good personnel. (Not enough scientists going through universities to support long term development of industry.) (20 other issues averaged 2%) The situation seems to mainly relate to a lack of government and public awareness of the issues and benefits of OOS. However, some interviewees note the beginnings of improvement following the Asian tsunami. 15
New solutions industry will deliver Q 23. What new solutions/technology do you expect the industry to deliver in the future (next five to ten years)? Q24. What other developments would you like to see happening in the future? • Many listed 16
Experience of Canadian companies Q 25. Do you, or your organization, have experience of Canadian companies in this sector? Europe seems to have more experience of working with Canadian companies than other regions “Canada is a major player in sector with many scientists active in the field. Lots of commercial companies. (France) “Use some Canadian instrumentations, optics are particularly good. Have had contact in past with Canadian Space Agency. (UK) “Canadian partners and network contacts (France) 17
Potential for collaborations with Canadian industry Q 26. Are you able to identify any potential collaborations with, or opportunities for, Canadian industry? Potential to convert the larger number falling within the ‘possibly’ category to ‘yes’. “Already work with ocean modeling companies, but always opportunities for more” (France) “Work with several Canadian companies….. Better and more co-operative to work with than the Americans. (UK) “Canada has strong academic programs in GPS geodesy” (USA) “Would like to work with Canadians” (UK) 18
Canada – any limiting factors Q 27. Are there any factors that may limit your organization’s ability to work with Canadian companies? (location, policy, etc) 90% of interviewees see no limiting factors In the case of those that did, two related to a lack of knowledge about their organisation’s policy towards purchasing foreign goods & services It is of note that these ‘policy issues’ were raised by US organisations! 19
Introduction The interviews The research The market Canada Conclusions
A complexity of organisations, programs & projects Above example shows linkages to just one program Particularly difficult to identify funding details Much contradictory and incomplete information available 21
Byzantine complexity of the ‘big picture’ One example of attempts to try to understand some of the linkages 22
OOS market data capture (organisations, projects & programs) 23
Introduction The interviews The research The market Canada Conclusions
Sectors, markets & services OOS ‘sectors’ are in reality comprised of ‘services’ applied to end-user ‘markets’ There is also a ‘total community’ market Many end-users obtain OOS information or results of analysis free-of-charge (e.g. weather forecasts) Some markets may set up a project-specific OOS e.g. military or offshore oil & gas 27
Market drivers include: • Response to global warming • Coastal population growth • The potential of a ‘coastal event’ • Growth in offshore energy extraction • Change in military activities • Marine security (response to 9/11) • The ‘China syndrome’ (economic growth) Many of the above are inter-related The global market for OOS is driven by a complex and interrelated set of factors ranging from climate change to the geopolitical, from military to geological. But without doubt, the largest driver for OOS is climate change. 28
1979 summer arctic sea ice pictures: NASA Goddard Space Flight Center Market Driver – global warming 2000
“15% of US Gulf of Mexico production still off line and 11% of gas” FT, 26 June 2006 “carbon dioxide emissions will rise by 75% by 2030” EIA, June 20 ‘06
Increased media pressure on politicians Montage: Weather Intelligence
OOS market by region (identified programs) $11 bn market 2007-11 North America (US) dominates global spend Europe important but much smaller Spend is by source and may be applied to other regions 32
OOS market by program type (identified programs) Satellite programs lead spend Ocean-based programs show good growth Note NOOA $700 million last-minute, single-year funding approval in 2007. An indication of the increased awareness in Congress that OOS is important. 33
Market by sector 2007-11 (identified programs) high cost of satellite-based programs 34
Market forecast to 2011 • Market growth from $1.8 bn (2006) to $2.4 bn (2011) • View based on: • Increasing international response to global warming • Need for increased operations and maintenance expenditure • Strong growth of the underlying user industries • View may prove to be too conservative 35
Introduction The interviews The research The market Canada Conclusions
Canada – user views From our survey, user views on Canadian organisations include: • “Better and more co-operative to work with than the Americans.” • “Would like to work with Canadians.” • “Would be very keen to work with Canadian companies.” • “Canada has strong academic programs in GPS geodesy.” • A leader in spatial information software/open source software development • 90% saw no restrictions to working with Canadian companies • But, a lack of international awareness about Canadian OOS-related projects • And, a belief that Canada represents a small potential market • Potential foreign customers for Canadian companies are often buying OOS-related products and services from competitors in the US and Europe 37
Introduction The interviews The research The market Canada Conclusions
Key strategic considerations • A need to develop international ocean observing system standards • Infrastructure support is lagging • Development of "appropriate" technology is necessary • Data acquisition management & communications systems • Long-term reliability of sensors • Meteorological reference data in real time • Coastal zone observations require new products • Oceanographic sensors longer life and more reliable • “Biological & chemical sensors are the least developed products” • Partnerships are essential for OOS to develop into a viable market – “IOOS is still a nebulous concept for many people” • International collaborations – like “trying to herd cats”. • Finding the people is a challenge – the competition is intense • Developing IOOS-related partnerships with NASA is challenging – “IOOS is an operational effort, NASA is a research-orientated mission” • Integrating space-based and in-situ observations – new technology is needed • Future technologies becoming reality – e.g. autonomous underwater & surface vessels. • Governments are the key clients (EO satellite data revenues “78% of sales to Government and other public sector clients”. Booz, Allen and Hamilton survey 2004) 39
Conclusions OOS is a major market, growing from $1.8 bn in 2006 to exceed $2.4 bn in 2011 OOS are an essential tool and awareness of this will grow in future years The U.S. is the world’s largest ocean industries player (market & supplier) Canada needs a carefully developed strategy to address the global market. 40
Recommendations – first thoughts • Develop a strategy to address the opportunities offered by the OOS market and the strengths and weaknesses of Canada in the sector: • Address the US market – as the world’s largest OOS market this demands specific study. • Consider how best to use Canada’s politically neutral image which could give marketing advantages in some countries. • Work at raising awareness of Canadian ocean technology. • Focus on identified technology needs: • Sensor accuracy, resolution, reliability, lifetime and cost, low maintenance costs. • Select a few sectors – carry out detailed market study on areas such as chemical and biochemical sensors and improvements to satellite-based sensors. • Low-cost platforms such as autonomous vehicles • Improvements in data transmission and management. • Develop OOS standards – could Canada take a lead? 41
Complete Reports & PowerPoint Presentations will be available on OSTP website in English and Frenchwww.ostp-psto.ca