Download
1 / 28
280 likes | 283 Views
This article provides a detailed explanation of Dynamic Energy Budget (DEB) theory and its applications in understanding metabolic organization and life history events. It covers topics such as homeostasis, standard DEB model, body size scaling relationships, parameter estimation, and more.

E N D
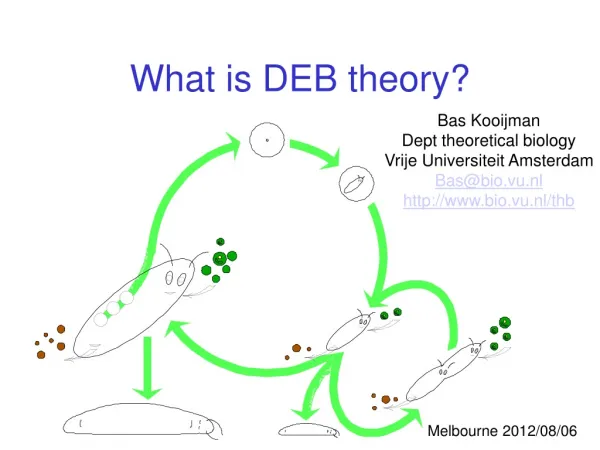
Life history events in DEB theory for metabolic organisation Bas Kooijman Dept theoretical biology Vrije Universiteit Amsterdam Bas@bio.vu.nl http://www.bio.vu.nl/thb/ Oslo, 2008/03/13
Life history events in DEB theory for metabolic organisation Bas Kooijman Dept theoretical biology Vrije Universiteit Amsterdam Bas@bio.vu.nl http://www.bio.vu.nl/thb/ • Contents: • What is DEB theory? • Homeostasis • Standard model & calorimetry • Allocation • Embryonic development • Unexpected links • Body size scaling relationships • Parameter estimation Oslo, 2008/03/13
Dynamic Energy Budget theory for metabolic organization • consists of a set of consistent and coherent assumptions • uses framework of general systems theory • links levels of organization • scales in space and time: scale separation • quantitative; first principles only • equivalent of theoretical physics • interplay between biology, mathematics, • physics, chemistry, earth system sciences • fundamental to biology; many practical applications
DEB theory is axiomatic, based on mechanisms not meant to glue empirical models Since many empirical models turn out to be special cases of DEB theory the data behind these models support DEB theory This makes DEB theory very well tested against data DEB theory reveals when to expect deviations from these empirical models Empirical special cases of DEB
Homeostasis strong homeostasis constant composition of pools (reserves/structures) generalized compounds, stoichiometric contraints on synthesis weak homeostasis constant composition of biomass during growth in constant environments determines reserve dynamics (in combination with strong homeostasis) structural homeostasis constant relative proportions during growth in constant environments isomorphy .work load allocation ectothermy homeothermy endothermy supply demand systems development of sensors, behavioural adaptations
defecation feeding food faeces assimilation reserve somatic maintenance maturity maintenance 1- maturation reproduction growth maturity offspring structure Standard DEB model Definition of standard model: Isomorph with 1 reserve & 1 structure feeds on 1 type of food has 3 life stages (embryo, juvenile, adult) • Extensions of standard model: • more types of • food and food qualities • reserve (autotrophs) • structure (organs, plants) • changes in morphology • different number of life stages
assimilation: substrate reserve + products linked to surface area dissipation: reserve products somatic maintenance: linked to surface area & structural volume maturity maintenance: linked to maturity maturation or reproduction overheads growth: reserve structure + products Product formation = A assimilation + B dissipation + C growth Examples: heat, CO2, H2O, O2, NH3 Indirect calorimetry: heat = D O2-flux + E CO2-flux + F NH3-flux Three basic fluxes
Mixtures of V0 & V1 morphs 3.7.2 volume, m3 hyphal length, mm Bacillus = 0.2 Collins & Richmond 1962 Fusarium = 0 Trinci 1990 time, min time, h volume, m3 volume, m3 Escherichia = 0.28 Kubitschek 1990 Streptococcus = 0.6 Mitchison 1961 time, min time, min
Growth: Von Bertalanffy -rule for allocation 3.5 Ingestion Respiration Ingestion rate, 105 cells/h O2 consumption, g/h Length, mm Length, mm Length, mm Reproduction Cum # of young • large part of adult budget • to reproduction in daphnids • puberty at 2.5 mm • no change in • ingest., resp., or growth • where do resources for • reprod. come from? Or: • what is fate of resources • in juveniles? Age, d Age, d
Initial amount of reserve Initial amount of reserve E0 follows from • initial structural volume is negligibly small • initial maturity is negligibly small • maturity at birth is given • reserve density at birth equals that of mother at egg formation Accounts for • maturity maintenance costs • somatic maintenance costs • cost for structure • allocation fraction to somatic maintenance + growth Mean reproduction rate (number of offspring per time): R = (1-R) JER/E0 Reproduction buffer: buffer handling rules; clutch size
Embryonic development 3.7.1 Crocodylus johnstoni, Data from Whitehead 1987 embryo yolk O2 consumption, ml/h weight, g time, d time, d : scaled time l : scaled length e: scaled reserve density g: energy investment ratio ;
Respiration ontogeny in birds 3.7.1 ml O2 d-1 ml CO2 d-1 altricial Troglodytes aëdon precocial Gallus domesticus age, d age, d • Observations: just prior to hatching • respiration shows a plateau in precocial, not in altricial birds • pore size and frequency in egg shell is such that O2 flux has constant resistance • Conclusion: ontogeny is constrained by diffusion limitation in precocial birds (Rahn et al 1990) • DEB theory: reserve dynamics controls ontogeny (same pattern in species without shells) • Minimization of water loss causes observed constant flux resistance
Foetal development 3.7.1 Foetes develop like eggs, but rate not restricted by reserve (because supply during development) Reserve of embryo “added” at birth Initiation of development can be delayed by implantation egg cell Nutritional condition of mother only affects foetus in extreme situations weight, g Mus musculus time, d Data: MacDowell et al 1927
Pupal development 17 °C • pupa = embryo in DEB theory • no uptake of resources • start of development with • very small amount of structure • initiation & termination linked • to maturity pupal weight, mg time, d green-veined white butterfly, Pieris napi Data from Forsberg & Wiklund 1988
Metamorphosis The larval malphigian tubes are clearly visible in this emerging cicada They resemble a fractally-branching space-filling tubing system, according to Jim Brown, but judge yourself …. Java, Nov 2007
Reduction of initial reserve 3.7.1 scaled maturity 1 scaled reserve 0.8 0.5 scaled age scaled age scaled struct volume scaled age
DEB theory reveals unexpected links Streptococcus O2 consumption, μl/h 1/yield, mmol glucose/ mg cells Daphnia 1/spec growth rate, 1/h Length, mm respiration length in individual animals & yield growth in pop of prokaryotes have a lot in common, as revealed by DEB theory Reserve plays an important role in both relationships, but you need DEB theory to see why and how
Primary scaling relationships assimilation {JEAm} max surface-specific assim rate Lm feeding {b} surface- specific searching rate digestion yEX yield of reserve on food growth yVEyield of structure on reserve mobilization v energy conductance heating,osmosis {JET} surface-specific somatic maint. costs turnover,activity [JEM] volume-specific somatic maint. costs regulation,defence kJ maturity maintenance rate coefficient allocation partitioning fraction egg formation R reproduction efficiency life cycle [MHb] volume-specific maturity at birth life cycle [MHp] volume-specific maturity at puberty aging ha aging acceleration Kooijman 1986 J. Theor. Biol. 121: 269-282 maximum length Lm = {JEAm} / [JEM]
Scaling of metabolic rate 8.2.2 Respiration: contributions from growth and maintenance Weight: contributions from structure and reserve Structure ; = length; endotherms
Metabolic rate slope = 1 Log metabolic rate, w O2 consumption, l/h 2 curves fitted: endotherms 0.0226 L2 + 0.0185 L3 0.0516 L2.44 ectotherms slope = 2/3 unicellulars Log weight, g Length, cm Intra-species Inter-species (Daphnia pulex)
Growth at constant food 3.7 length, mm Von Bert growth rate -1, d time, d ultimate length, mm Von Bertalanffy growth curve: time Length L. at birth ultimate L. von Bert growth rate energy conductance maint. rate coefficient shape coefficient
Von Bertalanffy growth rate 8.2.2 25 °C TA = 7 kK 10log von Bert growth rate, a-1 10log ultimate length, mm 10log ultimate length, mm At 25 °C : maint rate coeff kM = 400 a-1 energy conductance v = 0.3 m a-1 ↑ ↑ 0
Length at puberty 8.2.2 Clupoid fishes Sardinella + Engraulis * Centengraulis Stolephorus Clupea • Brevoortia ° Sprattus Sardinops Sardina Data from Blaxter & Hunter 1982 Length at first reproduction Lp ultimate lengthL
Feeding rate 8.2.2 slope = 1 Filtration rate, l/h Mytilus edulis Data: Winter 1973 poikilothermic tetrapods Data: Farlow 1976 Length, cm Inter-species: JXm V Intra-species: JXm V2/3
Scaling relationships 8.2.2 log scaled initial reserve log scaled age at birth log zoom factor, z log zoom factor, z approximate slope at large zoom factor log scaled length at birth log zoom factor, z
Two-sample case: D. magna 20°C Optimality of life history parameters?
measured quantities primary pars Standard DEB model (isomorph, 1 reserve, 1 structure) reserve & maturity: hidden variables measured for 2 food levels primaryparameters
DEB tele course 2009 http://www.bio.vu.nl/thb/deb/ Free of financial costs; some 250 h effort investment Program for 2009: Feb/Mar general theory April 18-22 symposium in Brest Sept/Oct case studies & applications Target audience: PhD students We encourage participation in groups that organize local meetings weekly Software package DEBtool for Octave/ Matlab freely downloadable Slides of this presentation are downloadable from http://www.bio.vu.nl/thb/users/bas/lectures/ Cambridge Univ Press 2000 Audience: thank you for your attention Stig Omholt: thank you for the invitation