Download
1 / 38
380 likes | 498 Views
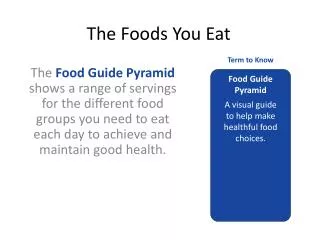
Better-for-you Foods. It’s Just Good Business. Hank Cardello Senior Fellow & Director Obesity Solutions Initiative October 9, 2013. Mission Drive win-win market solutions to obesity. The Issue: High Obesity Rates Persist and Are Impacting Business Practices.

E N D
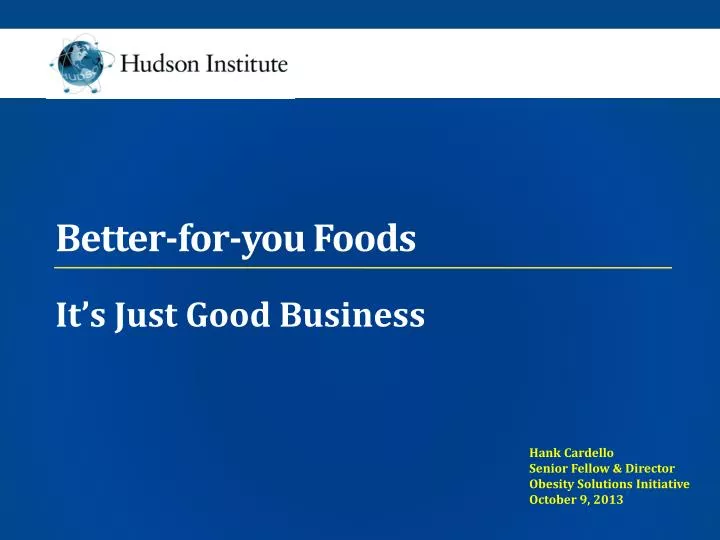
Better-for-you Foods It’s Just Good Business Hank Cardello Senior Fellow & Director Obesity Solutions Initiative October 9, 2013
Mission Drive win-win market solutions to obesity
www.hudson.org The Issue: High Obesity Rates Persist and Are Impacting Business Practices
www.hudson.org Is There a Business Case for Selling Better-for-you Foods & Beverages?
www.hudson.org The CPG Case for Better-for-you Products
www.hudson.org BFY Items Drove a Disproportionate Share of 5-Year Sales Growth Source: Nielsen Food, Drug and Mass Merchandiser sales tracking (2007-2011)
www.hudson.org Companies Growing Their BFY Products Faster Than Traditional Ones Exhibited Greater Overall Sales Gains Source: Nielsen Food, Drug and Mass Merchandiser sales tracking (2007-2011)
www.hudson.org These Same Companies Demonstrated Superior Operating Profit Growth % Growth in Operating Profit Source: Nielsen Data & Company Annual Reports (2007-2011)
www.hudson.org Lower-calorie Products Drove HWCF Company Sales Growth 82.0% 50.5% Source: Nielsen Food, Drug and Mass Merchandiser sales tracking (2006-2011)
www.hudson.org Lower-calorie Products Accounted for 2/3 of New Products Achieving Sales of $50+ Million 15 10 5 Source: Nielsen Food, Drug and Mass Merchandiser sales tracking (2006-2011)
www.Hudson.org The Restaurant Case for Lower-calorie Products
www.Hudson.org Lower Calorie Items Were the Key Growth Engine Across Both Foods & Beverages +2.5% +1.8% +4.5% +0.1% -1.6% -4.2% -2.3% -2.3% -4.9% Total Food & Beverages Food Only Beverages Only Source: NPD Group/Crest
www.Hudson.org Lower Calorie Items Outperformed Traditional Ones in Overwhelming Majority of Chains Source: NPD Group/Crest
www.Hudson.org Critical Same Store Sales (“SSS”) Metric Superior for Chains Growing Their Lower Calorie Servings Chains With Lower Calorie Servings Declines Total 21 Chains Chains With Lower Calorie Servings Growth Sources: Nations Restaurant News, Trinity Capital, Company Annual Reports
www.hudson.org Better-for-you Case Studies
Health Improvement Model Cumulative* Achievement of GMI Sales Improved FY05-FY11 & F12-F16 Projection Key Drivers Nutritional ImprovementFY05-FY11 Decreasing Limiters 66% Increasing Positives 34% *On a cumulative basis: products that have been nutritionally improved more than once are counted only one time Focused on doing the right thing to make our products nutritionally better *includes: serving veg/fruit, antioxidants, probiotic, protein, omega-3, GMI Better-for-You
Reducing Sugar in Cereal Commitment to further reduce sugar levels KEY 2007 Sugar level 2008 Sugar level 2009 Sugar level 2010 Sugar level 13g 12g Goal Sugar level 11g ≤9g 10g 07 08 09 Goal 10
www.hudson.org Company Leads Peers in Operating Profits Source: Better-for-you Foods: It’s Just Good Business, Hudson Institute, 2011
www.hudson.org Corporate Social Responsibility Done Right
www.hudson.org Company Reaping Benefits from Strategic Shifts Source: Better-for-you Foods: It’s Just Good Business, Hudson Institute, 2011
www.hudson.org Restaurants Slowly Waking Up
www.Hudson.org Soda Consumption in Decline
www.Hudson.org French Fries Declining French Fry Trends (2006 to 2011) % Change in Servings Fries Share of Total Foods +1.2% 24.8% Total Food 24.1% -1.9% French Fries Source: NPD Group/Crest – QSR chains ˃ $3 billion; Fries ˃20% of chain servings
www.Hudson.org Mandate for Healthier Kid’s Products
www.Hudson.org Traditional “Offenders” Heavily Targeted
www.Hudson.org What Can You Do?
1. Understand where your Better-for-you growth will come from
“One-size-fits-all” Approach Doesn’t Work • FENCE SITTERS®: 20% • ‘Wannabe’ healthy • Most likely to have kids • Stressed out, want help and control • More health kicks but no clear goals • Receptive to eco-friendly • Active weight loss • High social media usage • MAGIC BULLETS®: • 23% • Conveniently healthy • Heavy pill usage –supplements OTC, Rx • Health managers vs. preventers • Weight managers • Least likely to cook at home • Least likely to exercise • EAT, DRINK • & BE MERRYS®: 25% • Least health active • Unconcerned about prevention • Focused on taste • Most price driven • Younger • WELL BEINGS®: • 17% • Most health pro-active • Market leaders & Influencers • Highest organic usage • Use some supplements • Use many health modalities • Most Green • FOOD ACTIVES®: 15% • Mainstream healthy • Basics, balance and control • Desire inherently healthy foods • Most influenced by physicians • Least eco-friendly • Price sensitive
Growth Opportunity Segments • FENCE SITTERS®: 20% • ‘Wannabe’ healthy • Most likely to have kids • Stressed out, want help and control • More health kicks but no clear goals • Receptive to eco-friendly • Active weight loss • High social media usage • MAGIC BULLETS®: • 23% • Conveniently healthy • Heavy pill usage –supplements OTC, Rx • Health managers vs. preventers • Weight managers • Least likely to cook at home • Least likely to exercise • EAT, DRINK • & BE MERRYS®: 25% • Least health active • Unconcerned about prevention • Focused on taste • Most price driven • Younger • WELL BEINGS®: • 17% • Most health pro-active • Market leaders & Influencers • Highest organic usage • Use some supplements • Use many health modalities • Most Green • FOOD ACTIVES®: 15% • Mainstream healthy • Basics, balance and control • Desire inherently healthy foods • Most influenced by physicians • Least eco-friendly • Price sensitive
www.Hudson.org Example: Burger King “Satisfries” • 20% fewer calories • 25% less fat • Kept “Classic” fries
www.Hudson.org 2. Incorporate Healthier Oils
www.Hudson.org 3. Make Changes to Your Mainstays Quietly (“Stealth Health”)
Thank You! HCardello@Hudson.org www.Obesity-Solutions.org