Download
1 / 1
10 likes | 174 Views
Designing a Glider Network to Monitor Rapid Climate Change. Darcy Glenn 1 , Holly Ibanez 2 , Amelia Snow 3 , Oscar Schofield 3 1 University of Vermont 2 Florida Institute of Technology 3 Rutgers University.

E N D
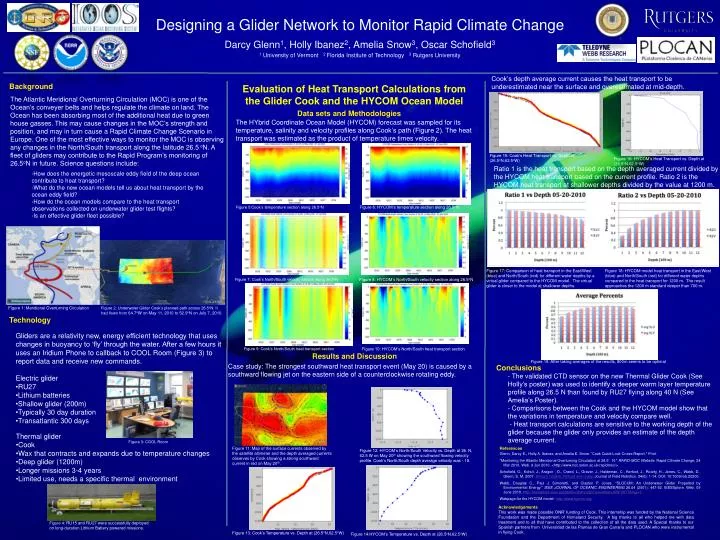
Designing a Glider Network to Monitor Rapid Climate Change Darcy Glenn1, Holly Ibanez2, Amelia Snow3, Oscar Schofield3 1 University of Vermont 2 Florida Institute of Technology 3 Rutgers University Cook’s depth average current causes the heat transport to be underestimated near the surface and overestimated at mid-depth. Background Evaluation of Heat Transport Calculations from the Glider Cook and the HYCOM Ocean Model The Atlantic Meridional Overturning Circulation (MOC) is one of the Ocean’s conveyer belts and helps regulate the climate on land. The Ocean has been absorbing most of the additional heat due to green house gasses. This may cause changes in the MOC’s strength and position, and may in turn cause a Rapid Climate Change Scenario in Europe. One of the most effective ways to monitor the MOC is observing any changes in the North/South transport along the latitude 26.5 oN. A fleet of gliders may contribute to the Rapid Program’s monitoring of 26.5oN in future. Science questions include: Data sets and Methodologies The HYbrid Coordinate Ocean Model (HYCOM) forecast was sampled for its temperature, salinity and velocity profiles along Cook’s path (Figure 2). The heat transport was estimated as the product of temperature times velocity. Figure 15: Cook’s Heat Transport vs. Depth at (26.5oN,62.5oW) Figure 16: HYCOM’s Heat Transport vs. Depth at (26.5oN,62.5oW) Ratio 1 is the heat transport based on the depth averaged current divided by the HYCOM heat transport based on the current profile. Ratio 2 is the HYCOM heat transport at shallower depths divided by the value at 1200 m. -How does the energetic mesoscale eddy field of the deep ocean contribute to heat transport? -What do the new ocean models tell us about heat transport by the ocean eddy field? -How do the ocean models compare to the heat transport observations collected on underwater glider test flights? -Is an effective glider fleet possible? Figure 6: HYCOM’s temperature section along 26.5oN Figure 5:Cook’s temperature section along 26.5oN Figure 17: Comparison of heat transport in the East/West (blue) and North/South (red) for different water depths by a virtual glider compared to the HYCOM model. The virtual glider is closer to the model at shallower depths. Figure 18: HYCOM model heat transport in the East/West (blue) and North/South (red) for different water depths compared to the heat transport for 1200 m. The result approaches the 1200 m standard deeper than 700 m. Figure 7: Cook’s North/South velocity section along 26.5oN Figure 8: HYCOM’s North/South velocity section along 26.5oN Figure 1: Meridional Overturning Circulation Figure 2: Underwater Glider Cook’s planned path across 26.5oN. It had flown from 64.7oW on May 11, 2010 to 52.9oN on July 7, 2010. Technology • Gliders are a relativity new, energy efficient technology that uses changes in buoyancy to ‘fly’ through the water. After a few hours it uses an Iridium Phone to callback to COOL Room (Figure 3) to report data and receive new commands. • Electric glider • RU27 • Lithium batteries • Shallow glider (200m) • Typically 30 day duration • Transatlantic 300 days Figure 9: Cook’s North/South heat transport section Figure 10: HYCOM’s North/South heat transport section Results and Discussion Figure 19: After taking averages of the results, 800m seems to be optimal Case study: The strongest southward heat transport event (May 20) is caused by a southward flowing jet on the eastern side of a counterclockwise rotating eddy. Conclusions - The validated CTD sensor on the new Thermal Glider Cook (See Holly’s poster) was used to identify a deeper warm layer temperature profile along 26.5 N than found by RU27 flying along 40 N (See Amelia’s Poster). - Comparisons between the Cook and the HYCOM model show that the variations in temperature and velocity compare well. - Heat transport calculations are sensitive to the working depth of the glider because the glider only provides an estimate of the depth average current. • Thermal glider • Cook • Wax that contracts and expands due to temperature changes • Deep glider (1200m) • Longer missions 3-4 years • Limited use, needs a specific thermal environment Figure 3: COOL Room Figure 11: Map of the surface currents observed by the satellite altimeter and the depth averaged currents observes by Cook showing a strong southward current in red on May 20th. References Figure 12: HYCOM’s North/South Velocity vs. Depth at 26. N, 62.5 W on May 20th showing the southward flowing velocity profile. Cook’s North/South depth average velocity was -.18. Glenn, Darcy E., Holly A. Ibanez, and Amelia E. Snow. "Cook Quick Look Cruise Report." Print. "Monitoring the Atlantic Meridional Overturning Circulation at 26.5°N." RAPID-MOC Website. Rapid Cllmate Change, 24 Mar 2010. Web. 9 Jun 2010. <http://www.noc.soton.ac.uk/rapidmoc/>. Schofield, O., Kohut, J., Aragon , D., Creed, L., Graver, J., Haldeman, C., Kerfoot, J., Roarty, H., Jones, C., Webb, D., Glenn, S. M. 2007. Slocum Gliders: Robust and ready. Journal of Field Robotics. 24(6): 1-14. DOI: 10:1009/rob.20200. Webb, Douglas C., Paul J. Simonetti, and Clayton P. Jones. "SLOCUM: An Underwater Glider Propelled by Environmental Energy." IEEE JOURNAL OF OCEANIC ENGINEERING 26.04 (2001): 447-52. IEEEXplore. Web. 09 June 2010. http://ieeexplore.ieee.org/stamp/stamp.jsp?arnumber=00972077&tag=1. Webpage for the HYCOM model: http://www.hycom.org/ Acknowledgements This work was made possible ONR’ funding of Cook. This internship was funded by the National Science Foundation and the Department of Homeland Security. A big thanks to all who helped me with data treatment and to all that have contributed to the collection of all the data used. A Special thanks to our Spanish partners from Universidad de las Plamas de Gran Canaria and PLOCAN who were instrumental in flying Cook. Figure 4: RU15 and RU27 were successfully deployed on long-duration Lithium Battery powered missions. Figure 13: Cook’s Temperature vs. Depth at (26.5oN,62.5oW) Figure 14:HYCOM’s Temperature vs. Depth at (26.5oN,62.5oW)