Download
1 / 24
240 likes | 352 Views
Second International Conference on Sustainable Irrigation University of Alicante, Spain, June 11-13, 2008. Sustainable Irrigation: The Role of Economic Instruments and Their Supporting Institutions by K. William Easter Professor of Applied Economics University of Minnesota. Introduction

E N D
Second International Conference on Sustainable IrrigationUniversity of Alicante, Spain,June 11-13, 2008 Sustainable Irrigation: The Role of Economic Instruments and Their Supporting Institutions byK. William EasterProfessor of Applied EconomicsUniversity of Minnesota
Introduction • 1. Key for sustainable water systems – adequate finances • 2. Historical cost recovery has been low (Table 1) • 3. Resulting in poor and declining service • 4. Poor operation and maintenance (O&M) • 5. Growing salinity problems and declining productivity • 6. Institutions are key to improved cost recovery • 7. Show this with successful projects
II. Outline of Presentation A. Definition of institutions and analytical framework B. Problem of designing effective institutions C. Why low cost recovery? D. What costs to recover? E. Cost allocation in multipurpose projects F. Alternative charges for cost recovery G. Key institutions for effective cost recovery H. Conclusions
III. Institutions for Water A. Definitions: 1. Institutions are the “rules of the game” while the players are the organizations, firms, or individuals” (North) 2. Institutional arrangements for water a. Defines who has access to water b. Establishes the range of options for water users c. Determines who can claim income and who pays for water use (Livingston) d. These may be formal or informal rules
B. Analytical Framework (Williamson, 2000) Level One – informal institutions such as norms, customs, mores, and religion. Beliefs regarding water as “basic right or an economic good” (Fig. 1). Level Two – rules for making rules, property right laws, and policies. Level Three – governance structures. For water, it ranges from spot market for water, to water contracts and allocations by water agencies (hierarchical). Level Four – actual exchange of water.
Figure 1. Levels of Institutional Analysis (developed from Williamson, 2000)
IV. Designing Institutions – What Effects Change? A. Problem of path dependency: old institutions and organization block change. (first level) B. Institution affected by physical environment especially the level of water scarcity. C. Lack of second-level institutions (legal system) resulting in weak third-level institutions. D. Changes in national economic policy preceded changes in Chile’s and China’s water institutions.
V. Why Has Cost Recovery Been Low? • 1. No linkage between fees collected and project O&M • 2. Lack of user participation • 3. Poor communication and lack of transparency • 4. No penalties for management or staff for providing poor service and water delivery • 5. No penalties for defaulting on payments • 6. Inappropriate infrastructure design • 7. Corruption among irrigation officials • 8. Low priority given to fee collection, efficient water use, and system O&M
VI. What Costs to Recovery? A. Direct project costs • Costs of capturing and delivering water• Fixed and variable costs of operations• Capital costs• Most projects focus on O&M B. Environmental costs: Soil erosion, damage to ecosystem, salinity, etc.C. Marginal user costs:Present value of future sacrifices caused by current resources use -- important in groundwater use
VII. Costs Allocation: Multipurpose Projects A. Two alternatives based on benefits gained:● Use of facilities (water delivered, Table 2) ● Separate costs, remaining benefits (Table 3) B. Indirect beneficiaries, e.g., consumer gets reduced food prices● Should consumers be allocated some of the costs (tax payers)? ● What share should farmers pay? ● With indirect benefits farmers pay only 70-80%
Table 2. Cost Allocation for Three Consumptive Uses Based on Water Delivery Source:World Bank, 2003.
Table 3. Cost Allocation Among Three Projects Based on Direct Benefits Source: World Bank, 2003.
VIII. Alternative Mechanisms for Collecting CostsA. Area-based charges ● Varied by hectare (ha.) ● Varied by hectare and crop, season or technology B. Volumetric charges ● Block charges: can vary charges and quantity at which charge increases (Figure 3) ● Two-part charge: fixed charge plus volumetric charge allows cost recovery and efficient pricing C. Water markets – sale or lease
IX. Key Institutional Arrangements for Cost Recovery A. Financial autonomy of projects 1. Needed to assure that funds collected are used to operate and improve their project 2. Managers have strong incentives to provide improved service and fee collection 3. Incentives to improve infrastructure: more water to sell ● Yangtze Basin Water Resource Project
IX. Key Institutional Arrangements for Cost Recovery – continued B. Improve incentives (to pay and to collect) 1. Haryana, India: defaulters can lose their land 2. Awati, China: awards and penalties encourage staff to achieve high collection rates 3. Bayi Irrigation District, China: awards and fines encourage staff to collect and turn in fees by deadline (Tables 4)
Table 4. Factors Influencing Fee Collection Rate N.A = Not available; 1 mu = 0.067 hectare. *Had significant water savings.
IX. Key Institutional Arrangements for Cost Recovery -- continued C. Increase user participation and transparency 1. Laur Projects, Philippines: rehabilitation and system turn over to water user associations (WUA) ● Farmer involved in design of rehabilitation and decisions on expenditures ● Cut costs 60% ● Collection jumped from 45 to 74% 2. Indonesia and Senegal: WUAs improved project design and cost recovery 3. WUAs in Mexico combined with water rights and payment before receiving water increased cost recovery 4. Benefits of WUAs in Maharashtra, India: 75% of farmers surveyed in WUAs willing to pay 25% higher fees
IX. Key Institutional Arrangements for Costs Recovery – continued D. Improved service and communication 1. System transparency ● Shangdong, China: IC machines 2. Assurance of water delivery ● Katepurna, India: service contracts 3. Public education on conserving water ● Katepurna, India and in Mexico
Conclusions • ● There is no one means to improve cost recovery● Successful strategies vary with different conditions in different countries● Transparency, financial autonomy, user participation, good service, and better incentives are keys to increasing costrecovery and sustaining water services.
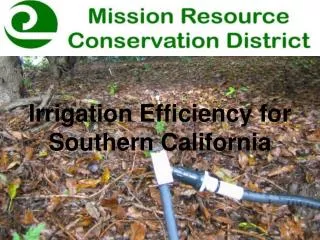
For irrigation the farm uses drip tape, which is a great way of reducing evaporation by getting the water to the soil surface one drip at a time.
URL to access paper and presentation. http://www.apec.umn.edu/faculty/weaster/