Download
1 / 16
260 likes | 1.17k Views
BISC 367 - Plant Physiology Lab Spring 2009. Plant Biology Fall 2006. Notices: O 2 electrode data IRGA data Reading material (Taiz & Zeiger): Chapter 3, Water and Plant Cells Chapter 4, Water Balance of Plants. The Importance of Water. Physiological aspects.

E N D
BISC 367 - Plant Physiology Lab Spring 2009 Plant Biology Fall 2006 • Notices: • O2 electrode data • IRGA data • Reading material (Taiz & Zeiger): • Chapter 3, Water and Plant Cells • Chapter 4, Water Balance of Plants
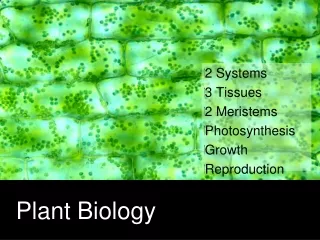
The Importance of Water • Physiological aspects
Movement of water in plants • Molecular diffusion • Water moves from an area of high free energy to area of low free energy • i.e. down a conc. gradient • Described by FICKS LAWJs = -Ds dcs/dx Js = flux density for s (mol m-2 s-1) Ds = diffusion coefficient dcs/dx = difference in water conc. over distance x
Movement of water in plants • Bulk flow • Movement of water in response to a pressure gradient • Analogous to water flowing in a pipe • Affected by: • Radius of pipe (r) • Viscosity of liquid (h) • Pressure gradient dyp/dx • Described by POISEUILLE’S equation: vol. flow rate (m3 s-1) = (pr4/8h)(dyp/dx)
Movement of water into a plant cell occurs by osmosis • 2 mechanisms: • Diffusion across the membrane • Bulk flow across aquaporins (water filled pores)
Movement of water into a plant cell occurs by osmosis • Water uptake is driven by a free energy gradient composed of: • Concentration gradient • Pressure gradient Free energy gradient for water movement is referred to as a Water PotentialGradient
Water Potential • Water potential (Yw) is equivalent to the free energy of water & influenced by: • Concentration (or activity) • Pressure • Gravity • Yw is the free NRG of water per unit volume (J m-3) • Divide chem. pot. of water (J mol-1) by the partial molal vol. (m3 mol-1) • Units equivalent to pressure (Pa)
Water Potential • Yw (Mpa) is a relative quantity and defined as: Chemical potential of water (in pressure units) compared to the chemical potential of pure water (at atm. pressure and temp.), which is set to zero
Water Potential Yw = Ys + Yp + Yg Ys = Solute component or osmotic potential Result of dissolved solutes that dilute water (entropy effect) Estimated using van’t Hoff’s eqtn (see p.44) Yp = Pressure component or pressure potential Yp inside a cell is positive = turgor pressure Yp in the apoplast is negative Note: Yp of pure water is zero, therefore not a measure of absolute pressure
Water Potential Yg = Gravity component Ignored unless considering vertical water movement > 5 m Dependent on: Height of water above ref. state (h) density (rw) acceleration due to gravity (g) Yg = rwgh rwg = 0.01MPa m-1
Plant Water Relations Cell wall (apoplast) water relations Yw = 0 Yw = 0 Ys(a) Cell (protoplast) water relations Ys(p) Yp(a) Yw(p) Yw(a) Yp(p) Whole plant water relations p = protoplast a = apoplast Yw = 0 Ys(a) Yp(a) Ys(p) Yw(p) Yw(a) Yp(p)
p is sensitive to small changes in cell volume • Relates to rigid cell wall, illustrated by Hofler diagram • Plot of Yw & its components against relative cell vol. • Initial drop in cell vol (5%) is accompanied by a sharp drop in Yp and Yw • As cell vol falls <90%, decreased Yw is accounted for by a lowered Ys as [solute] increases
p is sensitive to small changes in cell volume • Slope of Yp curve yields the volumetric elastic modulus (e) • e is a function of the rigidity of the cell wall • High value indicates a rigid wall for which a small vol. change translates into a large drop in Yp • e decreases as Yp falls b/c walls are rigid only when Yp is high
Typical values for Yw • Yw = -0.2 to -0.6 MPa • Plants are never fully hydrated due to transpiration • Ys = -0.5 to -1.5 MPa • Plants living in saline or arid environments can have lower values • Yp = 0.1 to 1.0 MPa • Positive values needed to drive growth and provide mechanical rigidity
Measuring Yw Scholander’s pressure bomb • A leaf or shoot is excised and placed in the chamber • Cutting the leaf breaks the tension in the xylem causing water to retreat into the surrounding cells • Pressurizing the leaf chamber returns water to the cut surface of the petiole • The amount of pressure to return water to the cut surface equals the tension (Yp) present in the xylem (but is opposite in sign) before excision • Values obtained approximate the tension in the xylem and are used as a measure of Yw • Strictly speaking to know the actual Yw some xylem sap should be collected to measure Ys From Plant Physiology on-line (http://4e.plantphys.net/)
Measuring Yw Relative water content • Assesses the water content of plant tissues as a fraction of the fully turgid water content • relevant when considering metabolic / physiological aspects of water deficit stress • Considered to be a better indicator of water status and physiological activity • Captures effects of osmotic adjustment • Osmotic adjustment lowers the Yw at which a given RWC is reached • Simple technique: • Leaf disks are excised, weighed (W) then allowed to reach full turgidity and re-weighed (TW). Leaf disks are dried to obtain their dry weight (DW). • RWC (%) = [(W – DW) / (TW – DW)] X 100