Download
1 / 24
240 likes | 334 Views
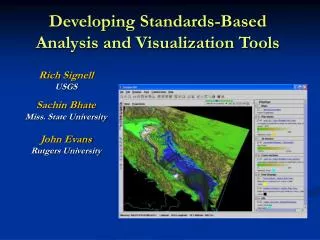
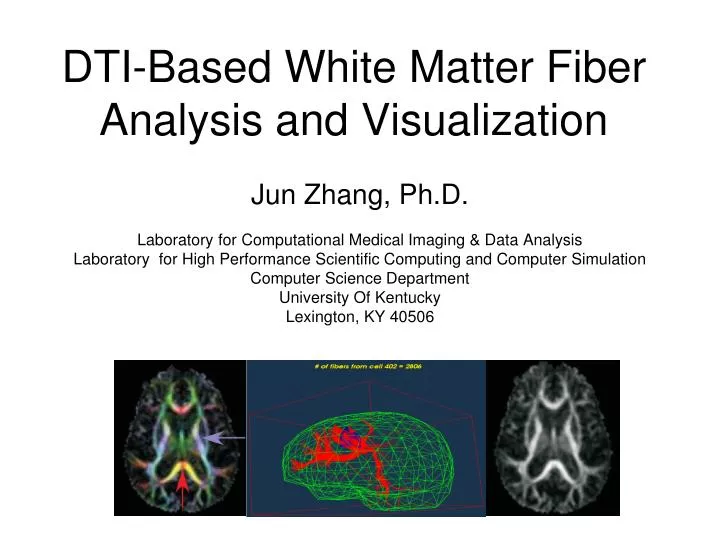
DTI-Based White Matter Fiber Analysis and Visualization . Jun Zhang, Ph.D. Laboratory for Computational Medical Imaging & Data Analysis Laboratory for High Performance Scientific Computing and Computer Simulation Computer Science Department University Of Kentucky Lexington, KY 40506.

E N D
DTI-Based White Matter Fiber Analysis and Visualization Jun Zhang, Ph.D. Laboratory for Computational Medical Imaging & Data Analysis Laboratory for High Performance Scientific Computing and Computer Simulation Computer Science Department University Of Kentucky Lexington, KY 40506
Outline • Introduction - DTI and AD • Methods • Experimental results • Discussion and Conclusion
Diffusion Tensor Imaging (DTI) The six gradients in the image acquisition may be: 1: (0.707, 0.707, 0.000) 2: (-0.707, 0.707, 0.000) 3: (0.000, 0.707, 0.707) 4: (0.000, -0.707, 0.707) 5: (0.707, 0.000, 0.707) 6: (-0.707, 0.000, 0.707) b0 means the gradient: (0.000, 0.000, 0.000) b0 and the six gradient applied images
Diffusion Tensor – Mathematical Model and Derived Diffusivity Measures T V = λV Det(T – λI) = 0 (T – λI) V = 0 Measures of the diffusivity:
Aging and Diffusions in the White Matter Linear (λ1 » λ2 ≈ λ3) Planar (λ1 ≈ λ2 » λ3) Spherical (λ1 ≈ λ2 ≈ λ3) It is widely believed that degradations of axons and oligodendrocytes result in value of fractional anisotropy (FA) reductions in neuropathological studies of AD.
Existing Approaches – Voxel Based Morphormetry (VBM) Rose et al 2006 Cons: No geometric spatial information is considered.
Existing Approaches – Region of Interest (ROI) Ying Zhang et al 2007 Cons: Only one or more intersections of fiber bundles are sampled. Subjective and conflict conclusions, Poor reproducibility, inconsistent
Objectives • to develop effective strategies to inspect possible tissue damages caused by regional micro structural white matter changes along the major bundles for both strong and hardly reconstructed fiber tract bundles • to interactively visualize hidden regional statistical features along neural pathways in vivo for a better understanding of the progression of certain brain diseases
Proposed Methods • DTI tractography – to approximate the volumetric neuronal pathways • Geodesic Distance Mapping - to re-parameterize fibers to establish point to point correspondences among fibers as well as subjects • Fiber tract bundle mask - to measure thin fiber bundles in group analysis • Isonode visualization method - to render explored regional statistical features along the fiber pathways
The Right Cingulum Fiber Bundle Mask Individual Tensor Images Averaged Tensor Image FA Eigenvectors Fiber Tracking The tracking target ROI plane is in blue – All fibers passing through this plane were kept.
Geodesics – To obtain a distance between two points of a connected Riemannian manifold, we take the minimum length among the smooth curves joining these points. The curves realizing this minimum for any two points of the manifold are called geodesics. Geodesics and Geodesic Distance The length is obtained as by integrating this value along the curve.
Illustration of Attributes Bundling a group of isonodes Isonodes (yellow) Fiber tracts (red) Starting point plane
Experiments - Subjects • 17 normal controls • 17 age matched amnestic mild cognitive impairment (MCI) patients • No significant difference exists which will invalidate the experimental results • 1.5T Siemens Sonata scanner • 256*256*48 and 0.9*0.9*2.75mm3 • Non-linearly registered all subjects’ b0 images
Experiments – Fiber Bundles • The left major cingulum bundle • The right major cingulum bundle • The GCC bundle (4 controls and 2 MCIs are excluded since their extracted short fiber tracts in the GCC bundle experiment) The GCC bundle in different views
Left Cingulum - Regional Structural White Matter Changes (FA) FA alteration (yellow) Left cingulum Seed points (blue) No white matter alteration is found for the right cingulum.
Left Cingulum - Voxels Exhibiting FA Degradations in MCI A group of 17 connected voxels (yellow) exhibit significantly different FA
The GCC Bundle - Averaged FA and MD Values of the Entire Volumetric Bundle Mean (±SD) values for FA and MD measures for computed GCC pathways for MCI and normal control groups. The unit of MD is (106 mm2/sec). Scatter Plots
The GCC Bundle - Regional Structural White Matter Changes (FA)
The GCC Bundle - Regional Structural White Matter Changes (MD)
Dependence on fiber tracking; Evaluating common parts (shortest) of fiber bundles; Relatively compact fiber bundle; Unclear – Structural connectivity and VBM; Discussion
Conclusion • A novel approach to measure regional diffusion property alterations along brain structural connectivity; • Experiment results show that this new analysis method may provide a more sensitive approach to evaluating the integrity of neural pathways human brain.
Acknowledgement • Collaborators • Stephen Rose, University of Queensland • Ning Kang, Ning Cao, Xuwei Liang, Qi Zhuang, UK Computer Science • Charles Smith, Peter Hardy, Brian Gold, UK Medical School