Download
1 / 28
280 likes | 444 Views
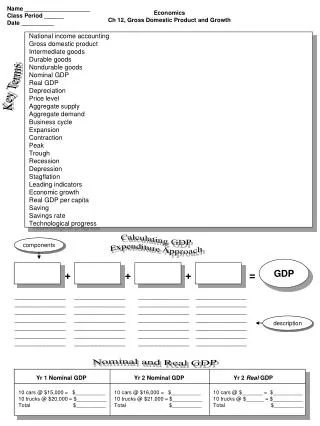
Ch 12 Economics. Gross Domestic Product And Growth. Section 1 – Gross Domestic Product GDP. STGs: Describe/Explain: NIPA (National Income & Products Accounts) How GDP is calculated How GNP (Gross NATIONAL Product) is calculated Difference between GDP and Gross NOMINAL Product

E N D
Ch 12 Economics Gross Domestic Product And Growth
Section 1 – Gross Domestic ProductGDP • STGs: Describe/Explain: • NIPA (National Income & Products Accounts) • How GDP is calculated • How GNP (Gross NATIONAL Product) is calculated • Difference between GDP and Gross NOMINAL Product • Main Limitations of GDP • Other Income & Output measures used to measure economic growth. • Factors that influence GDP
GDP • Why do economists track GDP? GDP is used to measure how the economy is doing. It is only one measure that is used. • What is GDP? GDP is the total of all FINAL goods and services produced WITHIN A COUNTRY’S BORDERS. • It does NOT include Final Good & Services produced by American firms OUTSIDE THE U.S. • It DOES INCLUDE THOSE MADE INSIDE U.S. BORDERS BY FOREIGN FIRMS. • Ex: Toyota auto factory in Ohio
GNPGross National Product • Is similar to GDP EXCEPT: • It includes all final goods and services produced by American firms OUTSIDE U.S. borders. • This number has grown since the 1970s as more production is done overseas and in Mexico by American companies.
Real GDP vs Gross NOMINAL ProductPg 304, Figure 12.3Copy the formulas • NOTE: THIS IS NOT GROSS NATIONAL PRODUCT • Gross Nominal Product is adjusted for inflation. It is in CURRENT PRICES, so it is sometimes referred to as “Current GDP”. • Since prices today are usually higher than say, a year ago, Gross Nominal Product is higher than GDP without the inflation adjustment. • This is then compared to REAL GDP, which removes numbers inflated by prices.
How is GDP calculated?First Method… • Expenditure Method: Pg 302 The Total Spent on all Final Goods & Services in these areas:
How is GDP calculated?Second Method… • Income Approach: Pg 302, Figure 12.1, Pg 303 Economists also use this approach rather than relying on just one method. It is less practical, but more accurate. • It is the Combined Income of all of the nation’s working citizens. See Pg. 302, Figure 12.1
NIPA • What does the acronym mean? • Why is it used? • What are the four types of Info collected? • P • I • I • S
GDP: Main Limitations • Not everything is in GDP. Yet, it is valuable. Here’s what is NOT in GDP.Write a brief summary below each of them. • Nonmarket Activities • The Underground Economy • Negative Externalities • Quality of Life
Other Ways to Measure Economic Growth • A picture tells a thousand words. Copy the formula on Pg 306, Figure 12.4.
Influences on GDP • Aggregate Supply – The total of all goods and services available in the economy at all possible price levels. As Price Level falls, so does real GDP. As prices fall, output usually does, too. (Law of Supply) • Aggregate Demand- The total of all goods and services that will be purchased at all possible price levels. An increase in Demand would result in a/an _______________ in GDP.
Section 2 Business Cycles • STGs: Describe/Explain • Phases of the Business Cycle • Four key factors that keep the Business Cycle going • How economists predict fluctuations in the Business Cycle • Impact of Business Cycles on U.S. history • What might cause changes in U.S. business cycles in the future
Phases of the Business CyclePgs 310-11 • Summarize the following. Leave plenty of room. • Expansion • Peak • Contraction Types of Contractions: • Recession • Depression • Stagflation • Trough
Mark the Four Phases of a Business Cycle on the Diagram below
Four Key Factors or Four Main Variables that Affect Business Cycles Q & A: What phase is likely to occur with: • Low interest rates & positive consumer expectations? • Low business investment & high oil prices?
How economists predict fluctuations in the Business Cycle. • Economists look at past trends & current leading economic indicators to FORECAST THE FUTURE ECONOMIC SITUATION. • Who compiles the index or data on the leading indicators? ____________________ • How many leading indicators do they track? __ List three:
Impact of Business Cycles on U.S. history • The Great Depression changed the way many economists look at Business Cycles. • John Maynard Keynes – Economist who believed that modern economies might NOT have SHORT business cycles. • Government involvement could help shorten contractions and limit wide swings between peaks and troughs. • Keynes’ ideas formed the basis of FDR’s New Deal.
OPEC & Stagflation • OPEC – (Write in the full name for this acronym) • The rapid rise in crude oil in the 1970s caused EXTERNAL SHOCKS. • The increase in oil prices happened when OPEC ____________ the supply of oil. • The high oil prices and negative consumer expectations led to Stagflation. • Stagflation - Contraction & Rising Prices
Late 1970s & early 1980s • Suffered a recession • High interest rates • Unemployment Rate over 9% • Falling GDP
What might cause changes in U.S. business cycles in the future? • Debt • Interest rates • Consumer credit levels • Technology • And more… What do you think?
Section 3 Economic Growth • STGs: Describe/Explain • How economic growth is measured • Capital Deepening and how it contributes to economic growth • How saving and investing are related to economic growth • The impact of population growth, government and foreign trade on economic growth • Causes and Impacts of Technological Progress
Measuring Economic Growth Q: How to know if GDP has REALLY increased or if the increase is due to an increase in population? A: Use Real GDP Per Capita (per Capita means per person) Real GDP per Capita = Real GDP/Total Population
Capital Deepening • What is Capital Deepening? • Investing in Physical Capital (technology, equipment,…) • Investing in Worker Training • Impacts of Capital Deepening • Improves productivity • Leads to more output • Higher GDP
Saving/Investing & Economic Growth • Saving & Investing are the FUEL for Economic Growth • Provides the Capital for Businesses to grow • The MORE $ People have to Save, the MORE $ there is for Investment. Q: How can Government impact the Savings Rate? Pg 320-21 A: Offering tax exemptions, deferring taxes on $ put into savings, ,…
Impacts on Economic Growth * Positive Effects of Increased Population can be lowered/decreased by the skill level of our Population. For example, a highly skilled population not only has the potential to produce goods for export to other nations, but they are less likely to have extended periods of unemployment and government assistance.
Impacts of Technological Progress • Technological Progress increases efficiency, output and GDP without using more input. • Tends to increase REAL GDP • Resulting in a nation’s HIGHER Standard of Living
Causes of Technological Progress Pg 324: Summarize the 5 Causes: