Download
1 / 45
450 likes | 621 Views
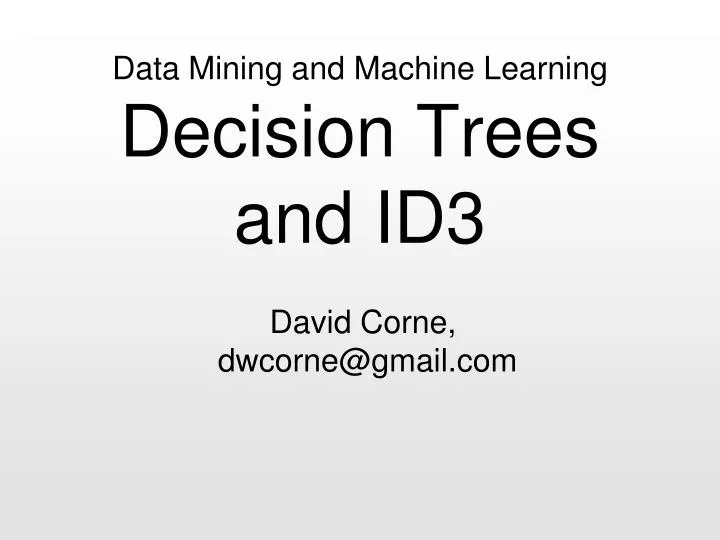
Data Mining and Machine Learning Decision Trees and ID3. David Corne, dwcorne@gmail.com. Decision Trees. Real world applications of DTs. See here for a list: http://www.cbcb.umd.edu/~salzberg/docs/murthy_thesis/survey/node32.html

E N D
Data Mining and Machine LearningDecision Trees and ID3 David Corne, dwcorne@gmail.com
Real world applications of DTs See here for a list: http://www.cbcb.umd.edu/~salzberg/docs/murthy_thesis/survey/node32.html Includes: Agriculture, Astronomy, BiomedicalEngineering, Control Systems, Financial analysis, Manufacturing and Production, Medicine, Molecular biology, Object recognition, Pharmacology, Physics, Plant diseases, Power systems, Remote Sensing, Software development,Text processing:
Field names Field values
Field names Field values Class values
Why decision trees? Popular, since they are interpretable ... and correspond to human reasoning/thinking about decision-making Can perform quite well in accuracy when compared with other approaches ... and there are good algorithms to learn decision trees from data
Figure 1. Binary Strategy as a tree model. Mohammed MA, Rudge G, Wood G, Smith G, et al. (2012) Which Is More Useful in Predicting Hospital Mortality -Dichotomised Blood Test Results or Actual Test Values? A Retrospective Study in Two Hospitals. PLoS ONE 7(10): e46860. doi:10.1371/journal.pone.0046860 http://www.plosone.org/article/info:doi/10.1371/journal.pone.0046860
We will learn the ‘classic’ algorithm to learn a DT from categorical data:
We will learn the ‘classic’ algorithm to learn a DT from categorical data: ID3
Suppose we want a tree that helps us predict someone’s politics, given their gender, age, and wealth
Add branches for each value of this field Age old young mid
Check to see what has filtered down Age old young mid 1 L, 2 R 1 L, 1 R 0 L, 1 R
Where possible, assign a class value Age old young mid 1 L, 2 R 1 L, 1 R 0 L, 1 R Right-Wing
Otherwise, we need to add further nodes Age old young mid 1 L, 2 R 1 L, 1 R 0 L, 1 R ? ? Right-Wing
Repeat this process every time we need a new node Age old young mid 1 L, 2 R 1 L, 1 R 0 L, 1 R ? ? Right-Wing
Starting with first new node – choose field at random Age old young mid 1 L, 2 R 1 L, 1 R 0 L, 1 R wealth ? Right-Wing
Check the classes of the data at this node… Age old young mid 1 L, 2 R 1 L, 1 R 0 L, 1 R wealth ? rich Right-Wing poor 1 L, 0 R 1 L, 1 R
And so on … Age old young mid 1 L, 2 R 1 L, 1 R 0 L, 1 R wealth ? rich Right-Wing poor Right-wing 1 L, 1 R
This is the tree we get if first choice is `gender’ gender female male Right-Wing Left-Wing
Algorithms for building decision trees (of this type) Initialise: tree T contains one ‘unexpanded’ node Repeat until no unexpanded nodes remove an unexpanded node U from T expand U by choosing a field add the resulting nodes to T
Algorithms for building decision trees (of this type) – expanding a node ?
Algorithms for building decision trees (of this type) – the essential step Field Value = X Value = Z Value = Y ? ? ?
So, which field? Field Value = X Value = Z Value = Y ? ? ?
Suppose we choose age(table now sorted by age values) Two of the values have a mixture of classes
Suppose we choose wealth(table now sorted by wealth values) One of the values has a mixture of classes - this choice is a bit less mixed up than age?
Suppose we choose gender(table now sorted by gender values) The classes are not mixed up at all within the values
So, at each step where we choose a node to expand, we make the choice where the relationship between the field values and the class values is least mixed up
Measuring ‘mixed-up’ness: Shannon’s entropy measure Suppose you have a bag of N discrete things, and there T different types of things. Where, pT is the proportion of things in the bag that are type T, the entropy of the bag is:
Examples: This mixture: { left leftleftright right} has entropy: − ( 0.6 log(0.6) + 0.4 log(0.4)) = 0.292 This mixture: { A AAAAAAABC } has entropy: − ( 0.8 log(0.8) + 0.1 log(0.1) + 0.1 log(0.1)) =0.278 This mixture: {same samesamesamesamesame} has entropy: − ( 1.0 log(1.0) ) = 0 Lower entropy = less mixed up
Information Gain ID3 chooses the field that maximises Information gain, defined as follows: H(D) is the entropy of the dataset at this point in the tree, just before the new choice of node. H(D|f) is the weighted entropy of the data after choosing field f. It is: e.g. If we choose wealth, and findthat the entropy of poor is 0.2, the entropy of rich is 0.1, and the relative proportions of remaining instances that are rich and poor is 0.6 and 0.4 respectively, then H(D|wealth) would be: 0.2x0.4 + 0.1x0.6 = 0.14 Information Gain is H(D) − H( D | f ) :
Information Gain ... but that’s overly complicated. ... Just remember that, in ID3, you calculate the weighted entropy of each field and choose the field that minimises this
Suppose we choose age(table now sorted by age values) Weighted entropy is: 0.3333 x − ( 0.5 x log(0.5) + 0.5 x log(0.5) ) + 0.1666 x − ( 1 x log(1) ) + x − ( 0.33 x log(0.33) + 0.66 xlog(0.66) ) 0.3333 0.16666 0.5
Suppose we choose wealth(table now sorted by wealth values) Weighted entropy is: 0.3333 x − ( 0.5 x log(0.5) + 0.5 x log(0.5) ) + x − ( 1 x log(1) ) 0.6666 0.3333
Suppose we choose gender(table now sorted by gender values) Weighted entropy is: 0.3333 x − ( 1 x log (1) ) + x − ( 1 x log (1) ) 0.3333 0.6666 This is the one we would choose ...
Alternatives to Information Gain- all, somehow or other, give a measure of mixed-upnessand have been used in building DTs • Chi Square • Gain Ratio, • Symmetric Gain Ratio, • Gini index • Modified Gini index • Symmetric Gini index • J-Measure • Minimum Description Length, • Relevance • RELIEF • Weight of Evidence
Decision Trees Further reading is on google Interesting topics in context are: Pruning: close a branch down before you hit 0 entropy ( why?) Discretization and regression: trees that deal with real valued fields Decision Forests: what do you think these are?