Download
1 / 35
350 likes | 487 Views
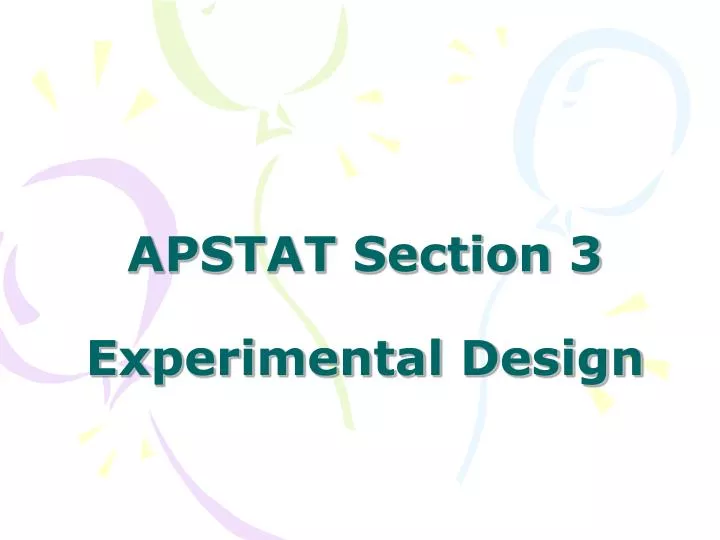
APSTAT Section 3 Experimental Design. Chapter 11 Simulation. HOW TO SET UP Describe the experiment Assumptions Independence Percentages Randomization Assign Digits (Table) Explain TI83 procedure Conduct Multiple Simulations Conclusion (Estimate Probability).

E N D
HOW TO SET UP • Describe the experiment • Assumptions • Independence • Percentages • Randomization • Assign Digits (Table) • Explain TI83 procedure • Conduct Multiple Simulations • Conclusion (Estimate Probability)
Simulated Simulation Problem • David Gamburd is a 70% Free Throw Shooter. One game he made only 4 out of 10 free throws and felt very sad. Is this a rare occurrence?
Describe Simulation • David, being a 70% shooter would be expected to make 7 out of 10 free throws. In order to determine the experimental probability of his 4 for 10 performance, I will conduct a simulation with 20 repetitions.
Assumptions • Each free throw is independent of the next free throw • David has a 70% chance of making each attempt
Assign Digits • Let the digits 0-6 be makes and 7-9 be misses
Conduct Simulations • Use Line 104 and group in 10’s, tally how many of the simulations end up with 4 or fewer makes 104 52711 38889 93074 60227 40011 85848 48767 52573 105 95592 94007 69971 91481 60779 53791 17297 59335 106 68417 35013 15529 72765 85089 57067 50211 47487 107 82739 57890 20807 47511 81676 55300 94383 14893 108 60940 72024 17868 24943 61790 90656 87964 18883 1. BOX OUT EACH SIMULATION 2. IDENTIFY MAKES AND MISSES: Makes= leave blank Misses=
Conclusions • In the simulation, only 2 of the 20 simulations resulted in a 4 of 10 performance or lower. • Based on our simulation, we estimate that David would hit 4 or fewer free throws (out of 10) about 10% of the time.
Do same Simulation Using TI83 • EXPLAIN Randomization • Using my TI83, I will use a random integer program to spit out 10 integers between 1 and 10. 1 through 7 will represent a “make” and 9 through 10 will represent a “miss” • I will then count the number of “makes” in each group of ten
Conduct Simulation Trial #makes 1 7 2 6 3 7 4 7 5 9 6 5 7 7 8 6 9 8 10 7 Randint(1,10,10) Trial #makes 11 8 12 5 13 6 14 4 15 7 16 8 17 6 18 5 19 7 20 7
Sample Surveys • Why a Sample? • Asking everyone in a population may be impossible or cost-prohibitive • ie. Field Day T-Shirts • 2004 Too many L and XL • Molly does survey of SR Girls sizes • I extend(ish) percentages to other classes • People are happier • Idea is to get data that is representative of the larger group as a whole.
A Little Vocab • Population • Whole group we want info on • In Field Day example, population is WPS high schoolers • Sample • Part of the population whom we get the info from • In Field Day example, sample was 17 senior girls
Types O’ Samples • Voluntary Response • People decide for themselves whether to participate or not • Radio opinion surveys • Not a good sampling option • Convenience Sampling • Take sample of individuals easiest to reach. • Field Day T-shirts • Not a good sampling option
Are there any good sample designs out there? Yep! • SIMPLE RANDOM SAMPLE (SRS) • Selecting individuals at random without replacement. • Every member in the population has an EQUAL chance of being selected • ie. Pick 5 names out of a hat
SRS HOW TO • Assign all individuals in population a number from 1 to n (n=#in population) • Use a random number generator or a table of random numbers to choose the desired # of individuals for your sample
Let’s Do One!!!! (CALC) • Choose an SRS of 5 Priory APStat Students. #1 List all Students 1 2 3 4 5 6 7 Ted Whitney Alicia Steph Yoon-Young Lampert Mariana 8 9 10 11 12 13 14 Sharuch Munger Sean Leah Chrissa Alexa Blaine #2 Assign #’s #3 Use MATH> PRB> RndInt(1,14,5)
Let’s Do One!!!! (TABLE) • Choose an SRS of 5 Priory APStat Students. #1 List all Students 1 2 3 4 5 6 7 Ted Whitney Alicia Steph Yoon-Young Lampert Mariana 8 9 10 11 12 13 14 Sharuch Munger Sean Leah Chrissa Alexa Blaine #2 Assign #’s #3 Use Tbl o’ Rnd Digits. Line 104 104 52711 38889 9307460227 40011 85848 4876752573 105 95592 94007 6997191481 60779 53791 1729759335
Stratified Random Sample • Do not call this an SRS!!!!!!!!!!!! • Ex. I want a sample of 12 WPS High School Students but it may be important to have all 4 classes represented • Strata – 4 Classes • Separate entire Pop into strata and then do an SRS of 3 from each strata
More Vocab • Non-Response – Members of Population are chosen, but can not be contacted (no phone, @ work…) • Response Bias • Wording “agree or disagree, the taking of another’s life should never be condoned” • Appearance/Attitude of interviewer • Honesty of responders
Experimental Design • Observational study: • Checking out individuals and measuring variables of interest without actually imposing a treatment. Surveys are a type. • Experiment: • DELIBERATELY imposing some form of treatment(s) on individuals and observing their responses.
Factors/Levels/Treatments • Factor • Explanatory variable(s) in an experiment • Can have multiple levels • Example: • Steroid Use - Cream and Clear The factor “clear” has 3 levels clear The factor “cream” has 2 levels cream This gives us 6 total treatments
Comparative Experiment • Treatment > Observation • 4th grade plant experiments • Observe > Treatment > Observe • Rogaine!!!!! • Problem #1 – PLACEBO EFFECT • Vitamin C Example • To Combat Placebo Effect, Use a CONTROL GROUP!
Completely Randomized Experiment • Vitamin C Experiment: Group1 Treatment1 Random Allocation Compare Group2 Treatment2 IMPORTANT! You may not be dealing with an SRS, so do not state that you have one. Random allocation is not an SRS.
Completely Randomized Experiment • Cream and Clear: Group1 Treatment1 Group2 Treatment2 Group3 Random Allocation Treatment3 Compare Group4 Treatment4 Group5 Treatment5 Group6 Treatment6
Double Blind • Subjects don’t know which treatment • People who administer treatment don’t know
Block Design • Blocks help control lurking variables • Blocking creates groups that are similar with respect to the blocking factor(s) • Treatments assigned randomly in each block
Room Temperature vs. Calculus Exam Grade • Temp Is Explanatory Variable • 4 sections • 2 @ 75 degrees, 2 @ 65 degrees • If we find higher scores in 65 degree classes can we conclude that a lower temperature results in higher grades? • What lurking variables???
Room Temperature vs. Calculus Exam Grade • Say we control everything but teacher. Two Calc Teachers w/ two sections each….Block for teacher! 75 degree Teacher1 Compare 65 degree Subjects Compare 75 degree Teacher2 Compare 65 degree
Matched Pairs • Type of Blocked design • Two treatments • Each block 2 similar units/individuals • Assigned randomly to treatments • Example: Effect of a cancer fighting drug. Researchers are concerned that age may be a lurking variable
Matched Pairs SUBJECT AGE 1 25 2 27 3 32 4 35 5 36 6 37 7 43 8 46 9 56 10 60 Older people may be more prone to cancer with or without the treatment and if I did a random allocation, there is a chance I could have mostly older people in one group and mostly younger ones in the other TREATMENT 1 TREATMENT 2 TREATMENT 2 TREATMENT 1 TREATMENT 2 So……Match up subjects with similar traits in terms of the variable I wish to block for. In this case, age. TREATMENT 1 TREATMENT 1 TREATMENT 2 Randomly allocate treatments in each pair. Compare each pair. Compare the pairs! TREATMENT 2 TREATMENT 1
Matched Pairs – Another Way • One Individual • Both Treatments • One after the other • Order may matter • Randomize to determine which goes 1st • Example: • Hand Squeezing Strength Experiment
Hand Squeezing Strength Experiment • Is your strong hand really stronger than your weak hand? • Subject may be a better squeezers the 2nd time Compare individual differences S-W Strong Group1 Strong 1st Weak Random allocation Subjects Compare Weak Compare individual differences S-W Group2 Strong 2nd Strong