Download
1 / 15
150 likes | 287 Views
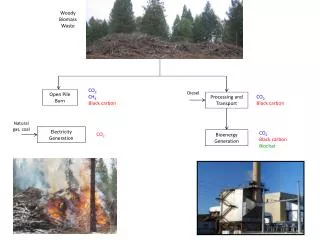
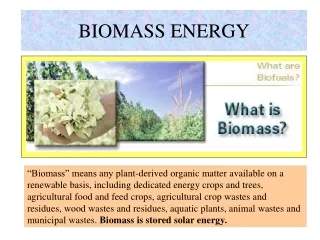
Energy Renewable Biomass and Waste Biomass fuels include residues from logging; mill operations; processing of wood, pulp, paper, fiberboard; agricultural crops; livestock and poultry operations; food processing; demolition (urban wood waste)

E N D
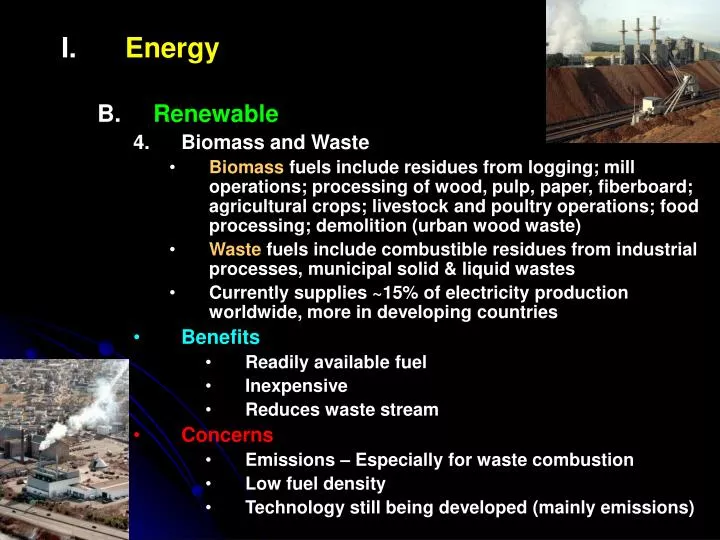
Energy • Renewable • Biomass and Waste • Biomass fuels include residues from logging; mill operations; processing of wood, pulp, paper, fiberboard; agricultural crops; livestock and poultry operations; food processing; demolition (urban wood waste) • Waste fuels include combustible residues from industrial processes, municipal solid & liquid wastes • Currently supplies ~15% of electricity production worldwide, more in developing countries • Benefits • Readily available fuel • Inexpensive • Reduces waste stream • Concerns • Emissions – Especially for waste combustion • Low fuel density • Technology still being developed (mainly emissions)
Energy • Renewable • Geothermal • Heat from deep within earth captured and used to turn an electric generation turbine • Benefits • Inexpensive • Minimal environmental impact – Little pollution • Energy security – US has extensive resources • Concerns • Limited use geographically • Not truly renewable (water injection can prolong life of geyser field) • Geothermal emissions may include CO2 and H2S, as well as various toxic compounds • Not economically viable in most areas • Geological risks
Energy • Renewable • Fuel Cells • Many types • All have membrane that only allows positively charged particles to cross and external shunt that channels electrons • Have been used for decades (powered manned space flights) • Benefits • Low emissions • Highly efficient (up to 85% in some cases) • No moving parts – Enhances durability, simplifies maintenance • Energy security – Can be produced anywhere • Concerns • Technology still in its infancy • Energy input during processing • Risks of handling hydrogen and other fuels • Currently very expensive www.fuelcells.org
Energy • Renewable • Biofuels • Bioalcohols • Biodiesel • Biogas • Benefits • Renewable • Energy security • Reduced waste stream for raw materials • Reduced environmental impacts vs. other energy sources • Concerns • “Food vs. Fuel” – Elevated food prices • Not carbon neutral or carbon negative • Growing crops & processing for fuel requires land and water • Pesticides may contaminate local aquifers • Emissions from biofuels (air pollution)
Gibbs et al. 2008
Righelato and Spracklen 2007
Energy • Renewable • Other • Tidal energy • Wave energy • OTEC (Ocean Thermal Energy Conversion) • Fusion
Fresh Water • Historically limiting factor in arid regions • 1940-1990 • World population more than doubled • 2.3 billion 5.3 billion • Per capita water use doubled • 400 m3 person-1 year-1 800 m3 person-1 year-1 • Global water use increased fourfold • 2000: USA ~2000 m3 person-1 year-1 (~1450 galday-1) • Current Status • In 1996, world human population using estimated 54% of all accessible fresh water in rivers, lakes, aquifers • Many people predict disastrous consequences for world’s fresh water supply in coming years • This potential disaster may have several causes
Fresh Water • Current Status • Distribution • Uneven compared to population • 75% of annual rainfall in areas containing less than one-third of global population • Amazon River carries 20% of global runoff through area containing 10 million people • Congo River carries 30% of Africa’s runoff through area containing 10% of population • Uneven in space • North America contains 19,000 m3 per person per year vs. 4700 m3 per person per year in Asia • <10% of Mexico supplies >50% of annual runoff • Uneven in time • India gets 90% of annual rainfall during summer monsoon season (Jun-Sep); runs off too rapidly for efficient use
Fresh Water • Current Status • Usage patterns • Agriculture – 69% • Industry/Energy – 23% • Domestic – 8% • Varies among regions and with development • Africa – 88% for agriculture (irrigation) • Europe – >50% for industry • Japan – Industrial but uses lots of water for growing rice • Spain/Portugal – Arid; use water heavily for agriculture • Personal use tracks standard of living • Africa – 17 m3 year-1 (12.3 gal d-1) • Asia – 31 m3 year-1 (22.4 gal d-1) • UK – 122 m3 year-1 (88.3 gal d-1) • US – 211 m3 year-1 (153 gal d-1) • By 2020, water shortages likely in Ethiopia, India, Kenya, Nigeria, China (parts of China already face problems) • Mexico City uses groundwater for 80% of municipal water supply • Depletion exceeds aquifer recharge rate by 50-80% • Sinking of land in some areas Damage to buildings • City imports water to meet demand
Fresh Water • Current Status • Contamination • Numerous examples worldwide • Biggest source = Agriculture • Europe – Over 90% of rivers have elevated nutrient levels from agrochemicals • Hungary – Nearly 40% of well fields contaminated • Developing countries – On average, 90% to 95% of all domestic sewage and 75% of all industrial waste discharged into surface waters without treatment • Impacts • Nile River – Diverting water + retention of sediment behind dams has caused fertile delta to shrink • Rhine River – Lost 8 of 44 fish species; 25 more endangered • Lake Chad – Diversion + drought has caused shrinkage from 25,000 to 2,000 km2 in 30 years Link • Aral Sea – Diversion for agriculture has caused severe shrinkage, with environmental & health problems L1L2
Fresh Water • Possible Solutions • World may have enough fresh water but inadequate distribution mechanism • Long pipelines and movement of icebergs have been proposed • Excessively expensive • Technological limitations
Fresh Water • Possible Solutions • Improved irrigation efficiency • Drip irrigation reduces losses from evaporation • Cuts water use by 40-60% compared to conventional systems • Used on <1% of irrigated land worldwide but used extensively in some countries (Ex – Israel uses DI on 50% of irrigated land) • Low-energy precision application (LEPA) methods apply water directly to plants • Can lower use of water and energy (20-50%) • Municipal conservation • Infrastructural losses can be substantial • Ex – 40-70% of water lost in transit in 15 major Mexican cities (similar rates in India) • Ex – Djakarta, Indonesia could cut water losses an estimated 20% by fixing leaky distribution pipes; would save ~12 billion gallons of water a year, enough to supply 800,000 people • Higher price could encourage conservation • Ex – Bogor, Indonesia increased water prices 3-4x; average household water use dropped by 30% in less than one year
Fresh Water • Possible Solutions • Reuse of urban wastewater • Use of treated wastewater for irrigation • Today, at least half a million hectares in 15 countries are being irrigated with “gray water” • More water-efficient industry • Practiced in industrialized nations. • Amount of water needed to produce a ton of steel ranges from 23 to 56 m3 in China, compared to an average of less than 6 m3 in US, Japan, and Germany • Desalination • 2010 – Over 20 billion gallons of fresh water produced daily in ~15,000 facilities worldwide • Minimum cost = 0.2¢ gal-1 • Current methods of desalination driven almost entirely by combustion of fossil fuels • Solar powered desalination plants produced only 1.4 million gal d-1 in 2009

![[PDF] DOWNLOAD Biomass to Renewable Energy Processes](https://cdn7.slideserve.com/12657097/pdf-download-biomass-to-renewable-energy-dt.jpg)
