Download

1 / 5
50 likes | 151 Views
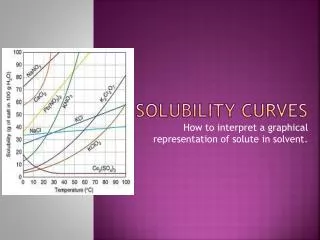
Solubility curves. Notes on how to read the graph The curve shows the # of grams of solute in a saturated solution containing 100 mL or 100 g of water at a certain temperature. Any amount of solute below the line = unsaturated Any amount of solute on the line = saturated

E N D
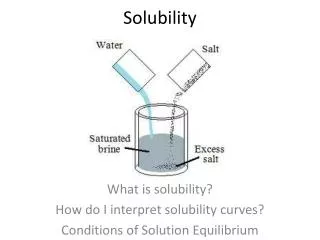
Notes on how to read the graph • The curve shows the # of grams of solute in a saturated solution containing 100 mL or 100 g of water at a certain temperature.
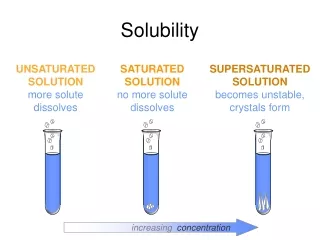
Any amount of solute below the line = unsaturated • Any amount of solute on the line = saturated • Any amount of solute above the line = supersaturated.
Practice – label the following amounts of solute as saturated, unsaturated or supersaturated 1. 120g of KI in water at 50◦C? 2. 40g of NH3 in water at 30◦C? 3. 80g of NH4Cl in water at 10◦C unsaturated saturated supersaturated
Solutes whose curves move upward w/ increased temperature are typically solids because the solubility of solids increases with increased temperature. • Solutes whose curves move downward with increased temperature are typically gases because the solubility of gases decreases with increased temperature. KI, NaNO3, KNO3, HH4CL, KCl, NaCl, KClO3 NH3, Ce2(SO4)3