Download
1 / 46
490 likes | 832 Views
Reflections on Macrosocial Factors & Health. George A. Kaplan University of Michigan. ©Ken Light. Center on Social Epidemiology and Population Health. Chronic Conditions more Prevalent among those with < 12 Years of Education: NHIS, 1989, 65+ years.

E N D
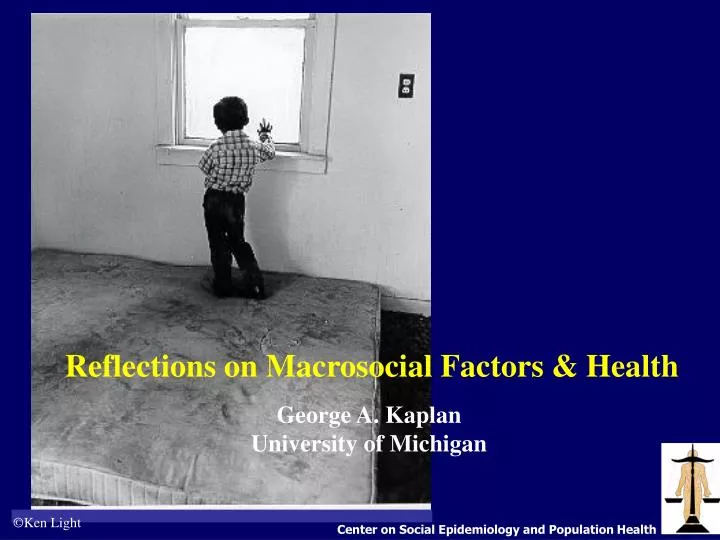
Reflections on Macrosocial Factors & Health George A. Kaplan University of Michigan ©Ken Light Center on Social Epidemiology and Population Health
Chronic Conditions more Prevalent among those with < 12 Years of Education: NHIS, 1989, 65+ years
Infant Mortality, 1995 Rank Country Rate 1 Finland 3.9 20 U.S., White 6.3 25 United States 7.6 28 Cuba 9.4 36 U.S., Black 14.6 Source: NCHS, 1999; Death per 1,000 Live Births
Do we just need more knowledge about the pathobiology of disease?
At the end of a century in which the average life expectancy in the United States has increased by nearly thirty years, victory over disease and disability has become an understandably popular and realistic goal.(emphasis added) Harold Varmus,Statement before the House and Senate Appropriations Subcommittees on Labor, Health and Human Services, and Education, February 23-24, 1999
Individual/Population Health Social and Economic Policies Institutions (including medical care) Neighborhoods and Communities Living Conditions Social Relationships `` Individual Risk Factors `` Lifecourse Genetic/Constitutional Factors Genetic/Constitutional Factors Pathophysiologic pathways Physical Environment Kaplan 1999
Macrosocial Effects on Health • Help the Neediest • Childhood and Lifecourse effects • Build Healthy Communities • Reduce and/or buffer the impact of growing income and wealth inequality • Don’t forget the “simple things” and the environment • Think globally • Eliminate lost opportunities
2.5 2.0 Relative Population Density 1.5 Risk Relative to Mean Income 1.0 0.5 Wolfson et al., 2000
Curvilinear relationship between income and health risks Increasing the economic resources of lower income households will have the greatest impact on a population’s health Employment, education, minimum wage, benefits such as childcare, housing subsidies, job flexibility,etc.
Macrosocial Effects on Health • Help the Neediest • Childhood and Lifecourse effects • Build Healthy Communities • Reduce and/or buffer the impact of growing income and wealth inequality • Don’t forget the “simple things” and the environment • Think globally • Eliminate lost opportunities
Parental Gestational Infancy Early Childhood Middle Childhood Adolescence Early Adulthood Middle Age Old Age
“Child Poverty League Table” % Children in poverty % Data from UNICEF (2000)
Low Wages and Child Poverty
Social Spending and Child Poverty
29-year Cumulative Impact of Economic Disadvantage on Five Health Outcomes No.of Times <200% of Poverty Lynch, Kaplan & Shema, NEJM, 1997
Total Mortality, US 1900-1995 Age Deaths per 100,000 population Arno personal communication, 2000
Sustained economic disadvantage can rob individuals and their communities of good health These effects spiral downward through families, with impact on children and the unborn This intergenerational transmission of disadvantage creates the matrix in which the inequalities in health of the future are produced Investments in communities and families can halt this propagation of health inequalities
Macrosocial Effects on Health • Help the Neediest • Childhood and Lifecourse effects • Build Healthy Communities • Reduce and/or buffer the impact of growing income and wealth inequality • Don’t forget the “simple things” and the environment • Think globally • Eliminate lost opportunities
Age-adjusted Survival by Poverty Area Residence: Alameda County Study, 1965-1974 Survival curves from Cox model, estimated at age=60 Haan, Kaplan, Camacho, 1987
DO NOT SITE OR QUOTE Harper et al, in prep--DO NOT QUOTE OR CITE
Gautreaux Assisted Housing Program Random allocation from waiting list for public housing to subsidized housing in similar or wealthier neighborhoods 7.5-13 years after the move (children around age 20) Reduction in school dropouts More likely to be in 4-year college Mothers more likely to be employed, earning more, and receiving employment- related benefits
Toward an Epidemiology of Everyday Life Gatrell AC, Geografsksa Annaler 1997; 79B:141-154
Substantial inequalities in health are seen between geographic areas that vary in level of economic resources These inequalities in health cannot be simply attributed to the behavior of area residents Differences in infrastructure, material conditions, and formal and informal organizations and institutions are at the heart of these differences Investments in communities may reduce current and future inequalities in health
Macrosocial Effects on Health • Help the Neediest • Childhood and Lifecourse effects • Build Healthy Communities • Reduce and/or buffer the impact of growing income and wealth inequality • Don’t forget the “simple things” and the environment • Think globally • Eliminate lost opportunities
Worldwide the gaps between the rich and the poor are growing
“….several studies have examined the impact of inequality upon economic growth. The picture they draw is impressively unambiguous, since they all suggest that greater inequality reduces the rate of growth.” Aghiou et al, 1999
Income Inequality and Mortality in US States, 1990 (adjusted for State Median Income) MS LA AL GA WV SC KY NV TN DE NC AR IL PA OH MD OK IN NY MI VA NJ MO AK TX ME VT CA WY MT RI OR Age-adjusted Total Mortality NM MA NH NE WI KS WA FL CO AZ CT IA ID SD MN ND r = - 0.62 UT HI Income Share Held by Poorest 50% of the Population Kaplan et al. BMJ (1996)
Trends in Inequality and Child Poverty 1967-1992 %Change in %Change in Inequality Child Poverty UK + 30 + 30 USA + 15 - 29 + 30 Sweden + 15 - 29 - 5 Australia + 10 - 15 0 Denmark + 10 - 15 - 5 Canada 0 - 5 Finland 0 - 5 Spain 0 0 Israel 0 + 5 - 10 W. Germany 0 + 5 - 10
Health effects of rising income inequality can be reduced by Direct effects of taxation, transfer, unemployment, minimum wage, & regulatory policies, etc. Loosening the links between income inequality & housing, community infrastructure, non-cash benefits, etc.
Macrosocial Effects on Health • Help the Neediest • Childhood and Lifecourse effects • Build Healthy Communities • Reduce and/or buffer the impact of growing income and wealth inequality • Don’t forget the “simple things” and the environment • Think globally • Eliminate lost opportunities
Tobacco Use-from the sacred to the profane-- and Socioeconomic Position Tobacco Use & Production Association between Smoking Prevalence and Socioeconomic Status (SES) Year < 1400 Shamanistic Uses Smoking Prevalence Development of ```Trade low high SES 1880’s Mass Production & Consumption Smoking Prevalence Developed Countries: Domestic Stagnation 1960-1970 low high SES Smoking Prevalence Developing Countries: Development of Foreign Markets 1980-90’s low high SES
Dams, canalsSchistosomiasis, Social disruption Agricultural Intensification Malaria Deforestation, new habitation Visceral Leishmaniasis
Macrosocial Effects on Health • Help the Neediest • Childhood and Lifecourse effects • Build Healthy Communities • Reduce and/or buffer the impact of growing income and wealth inequality • Don’t forget the “simple things” and the environment • Think globally • Eliminate lost opportunities
Social Impacts of 1998 Asian Financial Crisis in Thailand • Increases in: • poverty • unemployment • divorce rates • child abandonment • drug use Shivakumar et al., 2000
Debt Service vs. Other Expenditures in Pakistan Debt Service (350B) Development Health Budget Bhutta, 2000
Cash Flow in and out of Pakistan from World Bank and IMF, 1999-2000 Into Out of Net World Bank 250 514.2 -264.2 IMF 0 329.1 -329.1 Bhutta, 2000
Convenience & Fast Food Other Risk Factors Stress & Time Pressure Social Resources Globalization of the Economy Capital Concentration Leveraged buy-outs Real Wages Work Hours Job Insecurity Income and Wealth Inequality Changes in Occupational Structure Downsizing/Job Losses Flue-curing of tobacco Deforestation Cardiovascular Disease Meat Production Poor Nutrition Farming Migration High-strain, minimum wage jobs Social Cohesion Blood Pressure Smoking Obesity Epidemiologic Transition in Developing Countries Kaplan & Lynch, 1999
Macrosocial Effects on Health • Help the Neediest • Childhood and Lifecourse effects • Build Healthy Communities • Reduce and/or buffer the impact of growing income and wealth inequality • Don’t forget the “simple things” and the environment • Think globally • Eliminate lost opportunities