Download
1 / 26
280 likes | 717 Views
Waiting-Line Models. D. PowerPoint presentation to accompany Heizer and Render Operations Management, 10e Principles of Operations Management, 8e PowerPoint slides by Jeff Heyl. Outline. Queuing Theory Characteristics of a Waiting-Line System Arrival Characteristics

E N D
Waiting-Line Models D PowerPoint presentation to accompany Heizer and Render Operations Management, 10e Principles of Operations Management, 8e PowerPoint slides by Jeff Heyl
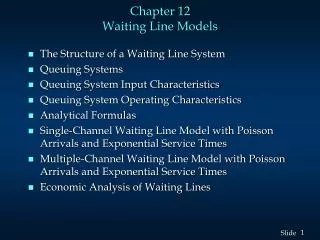
Outline • Queuing Theory • Characteristics of a Waiting-Line System • Arrival Characteristics • Waiting-Line Characteristics • Service Characteristics • Measuring a Queue’s Performance • Queuing Costs • Queuing Models • Model A(M/M/1): Single-Channel Queuing Model with Poisson Arrivals and Exponential Service Times • Little’s Law
Learning Objectives Describe the characteristics of arrivals, waiting lines, and service systems Apply the single-channel queuing model equations Conduct a cost analysis for a waiting line
Queuing Theory • The study of waiting lines • Waiting lines are common situations • Useful in both manufacturing and service areas
Common Queuing Situations Table D.1
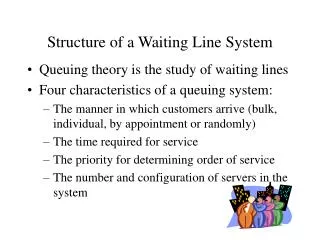
Characteristics of Waiting-Line Systems • Arrivals or inputs to the system • Population size, behavior, statistical distribution • Queue discipline, or the waiting line itself • Limited or unlimited in length, discipline of people or items in it • The service facility • Design, statistical distribution of service times
Population of dirty cars Arrivals from the general population … Queue (waiting line) Service facility Exit the system Dave’s Car Wash Enter Exit Arrivals to the system In the system Exit the system Parts of a Waiting Line • Arrival Characteristics • Size of the population • Behavior of arrivals • Statistical distribution of arrivals • Waiting Line Characteristics • Limited vs. unlimited • Queue discipline • Service Characteristics • Service design • Statistical distribution of service Figure D.1
Arrival Characteristics • Size of the population • Unlimited (infinite) or limited (finite) • Pattern of arrivals • Scheduled or random, often a Poisson distribution • Behavior of arrivals • Wait in the queue and do not switch lines • No balking or reneging
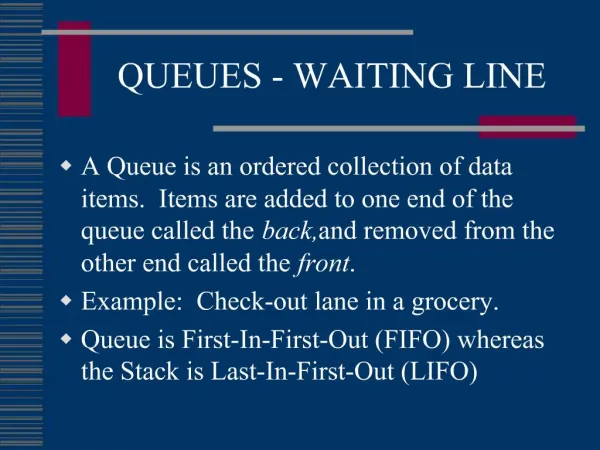
Waiting-Line Characteristics • Limited or unlimited queue length • Queue discipline - first-in, first-out (FIFO) is most common • Other priority rules may be used in special circumstances
Service Characteristics • Queuing system designs • Single-channel system, multiple-channel system • Single-phase system, multiphase system • Service time distribution • Constant service time • Random service times, usually a negative exponential distribution
Queue Departures after service Service facility Arrivals Queue Departures after service Arrivals Phase 1 service facility Phase 2 service facility Queuing System Designs A family dentist’s office Single-channel, single-phase system A McDonald’s dual window drive-through Single-channel, multiphase system Figure D.3
Service facility Channel 1 Service facility Channel 2 Departures after service Queue Arrivals Service facility Channel 3 Queuing System Designs Most bank and post office service windows Multi-channel, single-phase system Figure D.3
Phase 2 service facility Channel 1 Phase 2 service facility Channel 2 Phase 1 service facility Channel 1 Phase 1 service facility Channel 2 Departures after service Queue Arrivals Queuing System Designs Some college registrations Multi-channel, multiphase system Figure D.3
Measuring Queue Performance Average time that each customer or object spends in the queue Average queue length Average time each customer spends in the system Average number of customers in the system Probability that the service facility will be idle Utilization factor for the system Probability of a specific number of customers in the system
Cost Minimum Total cost Total expected cost Cost of providing service Cost of waiting time High level of service Low level of service Optimal service level Queuing Costs Figure D.5
Model Name Example A Single-channel Information counter system at department store (M/M/1) Number Number Arrival Service of of Rate Time Population Queue Channels Phases Pattern Pattern Size Discipline Single Single Poisson Exponential Unlimited FIFO Queuing Models Table D.2
Model A – Single-Channel Arrivals are served on a FIFO basis and every arrival waits to be served Arrivals are independent of preceding arrivals Arrivals are random and come from an infinite population Service times are variable The service rate is faster than the arrival rate
= Mean number of arrivals per time period µ = Mean number of units served per time period Ls = Average number of units (customers) in the system (waiting and being served) = Ws = Average time a unit spends in the system (waiting time plus service time) = µ – 1 µ – Model A – Single-Channel Table D.3
Lq = Average number of units waiting in the queue = Wq = Average time a unit spends waiting in the queue = = Utilization factor for the system = 2 µ(µ – ) µ(µ – ) µ Model A – Single-Channel Table D.3
P0 = Probability of 0 units in the system (that is, the service unit is idle) = 1 – Pn > k = Probability of more than k units in the system, where n is the number of units in the system = k + 1 µ µ Model A – Single-Channel Table D.3
= 2 cars arriving/hour µ = 3 cars serviced/hour Ls = = = 2 cars in the system on average Ws = = = 1 hour average waiting time in the system Lq = = = 1.33 cars waiting in line 2 3 - 2 µ – 1 3 - 2 1 µ – 22 3(3 - 2) 2 µ(µ – ) Single-Channel Example
Wq = = = 2/3 hour = 40 minute average waiting time = /µ = 2/3 = 66.6% of time mechanic is busy P0 = 1 - = .33 probability there are 0 cars in the system 2 3(3 - 2) µ(µ – ) µ Single-Channel Example = 2 cars arriving/hour µ = 3 cars serviced/hour
kPn > k = (2/3)k + 1 0 .667 Note that this is equal to 1 - P0 = 1 - .33 1 .444 2 .296 3 .198 Implies that there is a 19.8% chance that more than 3 cars are in the system 4 .132 5 .088 6 .058 7 .039 Single-Channel Example Probability of more than k Cars in the System
Total hours customers spend waiting per day = (16) = 10 hours Customer waiting-time cost = $10 10 = $106.67 2 3 2 3 2 3 Single-Channel Economics Customer dissatisfaction and lost goodwill = $10 per hour Wq = 2/3 hour Total arrivals = 16 per day Mechanic’s salary = $56 per day Total expected costs = $106.67 + $56 = $162.67
In-Class Problems from the Lecture Guide Practice Problems Problem 1: A new shopping mall is considering setting up an information desk manned by one employee. Based upon information obtained from similar information desks, it is believed that people will arrive at the desk at a rate of 20 per hour. It takes an average of 2 minutes to answer a question. It is assumed that the arrivals follow a Poisson distribution and answer times are exponentially distributed. (a) Find the probability that the employee is idle. (b) Find the proportion of the time that the employee is busy. (c) Find the average number of people receiving and waiting to receive some information. (d) Find the average number of people waiting in line to get some information. (e) Find the average time a person seeking information spends in the system. (f) Find the expected time a person spends just waiting in line to have a question answered (time in the queue).
In-Class Problems from the Lecture Guide Practice Problems Problem 2: Assume that the information desk employee in Problem 1 earns $10 per hour. The cost of waiting time, in terms of customer unhappiness with the mall, is $12 per hour of time spent waiting in line. Find the total expected costs over an 8-hour day.