Download
1 / 28
331 likes | 595 Views
1.3 Government Intervention. U nit Overview. 1.3 Government Intervention. The Role of Government. The Role of Government in the Market Economy Up to this point, we have examined how free markets work.

E N D
1.3GovernmentIntervention Unit Overview
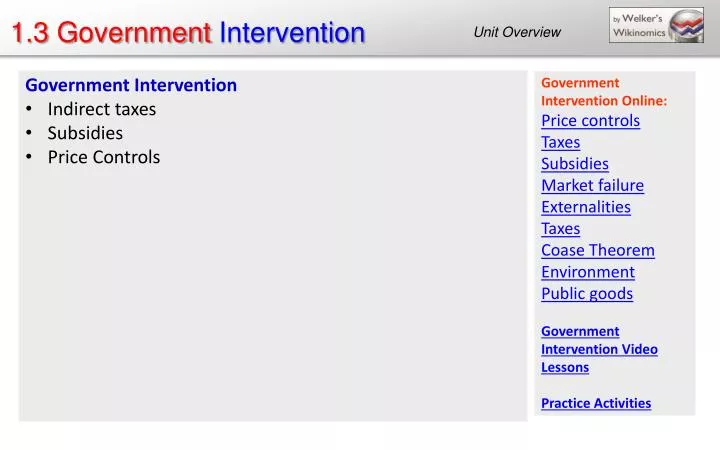
1.3GovernmentIntervention The Role of Government • The Role of Government in the Market Economy • Up to this point, we have examined how free markets work. • A free market is one without any government control or intervention. The price and output is determined by the interactions of buyers and sellers • However, not all markets are completely free. Governments tend to intervene often to influence several variables in markets for particular goods, such as: • Taxing the good to discourage consumption or raise revenues: Indirect taxes • Paying producers of the good to reduce costs or encourage the good’s production: Subsidies • Reducing the price of the good below its free market equilibrium to benefit consumers: Price Ceilings • Raising the price of a good above its free market equilibrium to benefit producers: Price Floors • When governments intervene in the free market, the level of output and price that results is may NOT be the allocatively efficient level. In other words, government intervention may lead to a misallocation of society’s resources.
1.3GovernmentIntervention Indirect Taxes • Indirect Taxes • An indirect tax is one placed by the government on the producers of a particular good. • Consumers will pay the tax indirectlythrough producers • An indirect tax will be shared by both consumers and producers Pencil market P S+tax • The effect of an indirect tax on the market for a good: Examine the market for pencils. • Assume the government decides to place a $0.50 tax on pencil production to raise revenue to support the pen industry. • The tax is an additional cost for pencil producers, so the supply of pencils decreases. • Supply will shift UP by $0.50 • The price of pencils increases from $1.25 to $1.55. • Once the tax is paid, pencil producers get to keep just $1.05 S 1.55 $0.50 1.25 1.05 D Qe Q Qtax
1.3GovernmentIntervention Indirect Taxes Determining the Effect of Indirect Taxes As we saw on the previous slide, a tax reduces the supply of a good and increases the price. The following points should also be observed. • The price of the good does not increase by the full amount of the tax • The producers of the good do not keep the full price paid by consumers, as they must pay the tax • There is a loss of total welfare in the market resulting from the tax. • The $0.50 tax on pencils… • Increase the price consumers pay by $0.30. • Decreases the price producers get to keep by $0.20. • Decreases the output from Qe to Qtax • Imposes a burden on consumers equal to the blue area • Imposes a burden on producers equal to the red area. • Raises government revenue equal to the blue and red areas. • Causes a net loss of total welfare equal to the gray area. Pencil market P S+tax S 1.55 $0.50 1.25 1.05 D Qe Q Qtax
1.3GovernmentIntervention Indirect Taxes • The Effects of an Indirect Tax and PED • In the previous slide, consumers paid $0.30 of the $0.50 tax and producers paid only $0.20. The tax was shared, but consumers paid the larger share. Determining who will pay the larger share of a tax requires us to examine the price elasticity of demand for the good being taxed. • If demand is relatively elastic: Producers will bear the larger burden of the tax. Firms will not be able to raise the price by much out of fear of losing all their customers, therefore price will not increase by much, but producers will get to keep less of what consumers pay. • If demand is relatively inelastic: Consumes will bear the larger burden of the tax. Firms will be able to pass most of the tax onto consumers, who are not very responsive to the higher price, thus will continue to consume close to what they were before the tax. • Elasticity and government revenue: The implication for government of the above analysis is that if a tax is meant to raise revenue, it is better placed on an inelastic good rather than an elastic good. Taxing elastic goods will reduce the quantity sold and thus not raise much revenue.
1.3GovernmentIntervention Indirect Taxes The Effects of an Indirect Tax and PED Examine the effects of the same $1 tax on the two goods below, one a highly elastic good, the other a highly inelastic good. Good B Good A P P S+tax S+tax S S 2.90 $1 $1 2.20 2.00 2.00 1.90 1.20 D D Qtax Qe Qe Q Q Qtax
1.3GovernmentIntervention Indirect Taxes The Effects of an Indirect Tax and PED Observations: • The $1 tax on Good A (highly elastic demand): • $0.80 is paid by produces, and only $0.20 by consumers • Quantity falls dramatically. • The loss of welfare (gray triangle) is large • Revenue raised is small due to the large decrease in Q • The $1 tax on Good B (highly inelastic demand): • $0.90 is paid by consumers, and only $0.10 by producers • Quantity does not fall by much • The loss of welfare (gray triangle) is small • Revenue raised is greater than Good A because the quantity does not fall by much • Taxing goods with relatively inelastic demand will raise more revenue and lead to a smaller loss of total welfare, while taxing goods with elastic demand will lead to a larger decrease in quantity and a greater loss of total welfare. Good A Good B P P S+tax S+tax S S 2.90 $1 $1 2.20 2.00 2.00 1.90 1.20 D D Qtax Qe Qe Q Q Qtax
1.3GovernmentIntervention Indirect Taxes Video Lesson EXAMINING THE EFFECT OF AN EXCISE TAX ON AN INELASTIC GOOD – CIGARETTES
1.3GovernmentIntervention Indirect Taxes Video Lesson EXAMINING THE EFFECT OF AN EXCISE TAX ON AN ELASTIC GOOD – CANDY BARS
1.3GovernmentIntervention Indirect Taxes • The Effects of an Indirect Tax in Linear Supply Equations • A tax is an additional cost place on producers in a market. Therefore, a tax will affect the supply curve AND the supply equation. • One way to think about a tax is that it is a payment made by the producers to the government of a particular amount AFTER consumers have bought the good. • Therefore, to show the effect of a tax on a supply equation, we must subtract the amount of the tax from the price consumers paid. • Consider the supply of bread in a small town: • Assume a $1 tax is imposed on bread producers. This means that whatever consumers pay (P), producers will keep $1 less. The new supply equation is therefore: • This can be simplified: • The new supply of bread is:
1.3GovernmentIntervention Indirect Taxes • The Effects of an Indirect Tax in Linear Supply Equations • A $1 tax on the production of bread cause the supply to decrease. • The new supply of bread is: • Notice: • The ‘c’ variable in the equation decreased. This it the Q-intercept of supply, which is now lower on the Q axis, meaning supply has shifted to the left by 150 units, or up by $1. • The ‘d’ variable has not changed. The tax does not change the responsiveness of producers to price changes. They will still supply 150 more loaves for every $1 increase in price.
1.3GovernmentIntervention Indirect Taxes Video Lesson USING LINEAR EQUATIONS TO CALCULATE THE EFFECT OF AN INDIRECT TAX (FOR HL STUDENTS)
1.3GovernmentIntervention Subsidies Per-unit Subsidies A subsidy, in contrast to a tax, is a payment from the government to producer for each unit produced • The effect of a per-unit subsidy on the market for a good: Assume the government places a $0.50 subsidy on the production of pens. • Supply shifts ‘down’ by $0.50, since the subsidy reduces the marginal costs of pen producers. • The price consumers pay falls from $2 to $1.70. • The price producers receive for each pen is the $1.70 consumers pay plus the $0.50 subsidy, or $2.20 • There is a greater quantity of pens produced Pen market P S S+subsidy 2.20 2.00 $0.50 1.70 D Qe Qsubsidy Q
1.3GovernmentIntervention Subsidies Determining the Effect of Per-unit Subsidies As we saw on the previous slide, a subsidy increases the supply of a good and reduces the price. The following points should also be observed. • The price of the good does not decrease by the full amount of the subsidy • Pen consumers enjoy some of the benefit of the good, but producers also benefit • There is a loss of total welfare in the market resulting from the cost of the subsidy exceeding the benefit • The $0.50 subsidy for pens… • Decreases the price consumers pay to $1.70 • Increases the price producers receive to $2.20 • Increases the output from Qe to Qsubsidy • Increases Consumer Surplus by the red area • Increases Producer Surplus by the blue area • Costs tax payers an amount represented by the blue, red and gray areas Pen market P S S+subsidy 2.20 2.00 $0.50 1.70 • Causes a net loss of total welfare equal to the gray area (since the total cost to taxpayers exceeded the total increase in consumer and producer surplus) D Qe Qsubsidy Q
1.3GovernmentIntervention Subsidies Video Lesson THE EFFECTS OF A SUBSIDY ON MARKET EQUILIBRIUM
1.3GovernmentIntervention Subsidies • The Effects of a Per-unit Subsidy in Linear Supply Equations • A subsidy is a payment to producers for each unit produced, therefore it reduces the costs of producing each unit of goods. Lower costs increase supply and affect the supply equation • One way to think about a subsidy is that it is a payment to producers above and beyond the price consumers have to pay. • Therefore, to show the effect of a subsidy on a supply equation, we must ADD the amount of the subsidy to the price consumers paid. • Consider the supply of bread in a small town: • Assume a $1 subsidy is provided to bread producers. This means that whatever consumers pay (P), producers will receive $1 more. The new supply equation is therefore: • This can be simplified: • The new supply of bread is:
1.3GovernmentIntervention Subsidies • The Effects of a Per-unit Subsidy in Linear Supply Equations • A $1 subsidy to the producers of bread causes the supply to increase. • The new supply of bread is: • Notice: • The ‘c’ variable in the equation increased. This it the Q-intercept of supply, which is now closer to the origin on the Q axis, meaning supply has shifted to the right by 150 units • The ‘d’ variable has not changed. The subsidy does not change the responsiveness of producers to price changes. They will still supply 150 more loaves for every $1 price increase
1.3GovernmentIntervention Subsidies Video Lesson CALCULATING THE EFFECTS OF A SUBSIDY USING LINEAR EQUATIONS (HL ONLY)
1.3GovernmentIntervention Taxes and Subsidies • The Effects of Taxes and Subsidies on Consumers and Producers • We can determine how much of the tax burden was born by consumers and producers: • Effect of the tax • The price increased from $4.00 to $4.75, meaning consumers paid $0.75 of the $1.00 tax. • Producers got to keep just $3.75, meaning they paid just $0.25 of the $1.00 tax • Effect of the subsidy: • Price went down from $4.00 to $3.25, meaning consumers received $0.75 of the $1.00 subsidy. • Producers received $4.25, meaning they enjoyed $0.25 of the $1.00 subsidy.
1.3GovernmentIntervention Price Controls Price Controls Another form government intervention might take in a market is price controls. Price Ceiling: This is a maximum price, set below the equilibrium price, meant to help consumers of a product by keeping the price low. Price Floor: This is a minimum price, set below the equilibrium price, meant to help producers of a product by keeping the price high. P P S S Gasoline Market Corn Market Pf Pe Pe Pc D D QS QD Qe Qe Q Q QS QD
1.3GovernmentIntervention Price Controls The Effects of a Price Ceiling When a government lowers the price of a good to help consumers, there are several effects that we can observe in the market. Assume the government has intervened in the market for gasoline to make transportation more affordable for the nation’s households P S Gasoline Market • On consumers: • Quantity demanded increases (Qd) • The lower price leads to an increase in consumer surplus, which is now the blue area • The lower quantity means some consumers who want to will not be able to buy the good • On Producers: • The lower price means less producer surplus (red triangle) • The lower quantity means some producers will have to leave the market and output will decline (Qs) • On the market: • Overall, not enough gasoline is produced, and is the market is allocatively inefficient. The gray triangle represents the loss of total welfare resulting from the price ceiling. Pe Pc Shortage D QD Qe Q QS
1.3GovernmentIntervention Price Controls The Effects of a Price Floor When a government raises the price of a good to help producers, there are several effects that we can observe in the market. Assume the government has intervened in the market for corn to help farmers sell their crop at a price that allows them to earn a small profit. Corn Market P S • On consumers: • Quantity demanded decreases (Qd) • The higher price means there is less consumer surplus (blue area) • On Producers: • Quantity supplied increases (Qs) • The higher price means there is more producer surplus, but since consumers only demand Qd, there is an excess supply of unsold corn (Qd-Qs) • On the market: • Overall, the market produces too much corn and is thus allocatively inefficient. The increase in producer surplus is smaller than the decrease in consumer surplus. The total loss of welfare is represented by the gray triangle. Pf Pe Surplus D QS Qe Q QD
1.3GovernmentIntervention Price Controls Video Lesson DETERMINING THE EFFECTS OF PRICE CEILINGS AND PRICE FLOORS
1.3GovernmentIntervention Price Controls • Calculating the Effects of Price Controls using Linear Equations • As with taxes and subsidies, we can use linear supply and demand equations to calculate the effects of price ceilings and price floors. Once again, assume demand and supply for bread is: • and • As we have already shown, the current equilibrium price is $4 and the quantity is 400 loaves. • Assume the government wishes to help households afford bread, so imposes a price ceiling of $3 on bread. To determine the impact on the market, we must simply put $3 into both equations. • The $3.00 price ceiling will create a shortage of 200 loaves of bread. • Producers will reduce their output of bread and more consumers will wish to buy bread. • The price ceiling took a market that was efficientand made it inefficient. Not enough resources are allocated towards bread production as a result of the price ceiling.
1.3GovernmentIntervention Price Controls • Calculating the Effects of Price Controls using Linear Equations • Next, assume that the government determines that $4 is too cheap for bread, and producers need the price to be higher. The government imposes a price floor of $5 in the market. To determine the impact on the market, we must simply put $3 into both equations. • The $5.00 price floor will create a surplus of 200 loaves of bread. • Producers will increase their production of bread to take advantage of the now higher prices it is commanding in the market. • Consumers will reduce the quantity of bread they demand due to the now higher price. • The price floor took an efficient market and made it allocatively inefficient. Too many resources are now being allocated towards bread production! • Conclusion: Price controls rarely increase efficiency or total welfare in a market. They result in either shortages (price ceilings) or surpluses (price floors), and therefore lead to a net loss in total welfare for society. Some benefit, but many suffer.
1.3GovernmentIntervention Price Controls Video Lesson CALCULATING THE EFFECTS OF PRICE CONTROLS USING LINEAR EQUATIONS (HL ONLY)
1.3GovernmentIntervention Price Controls Coffee Market Buffer Stock Schemes One form of government intervention, often used in the markets for certain agricultural commodities, combines price controls and subsidies. A buffer stock scheme: A policy that regulates the price of non-perishable agricultural commodities to keep it within a narrow range that is deemed desirable for both producers and consumers. Consider the market for coffee below: P S S2 Pmax • There is a price ceiling above the current equilibrium, and a price floor below the current equilibrium. At present, neither is binding. • In a good year: The supply of coffee increases to S1. The price floor now become binding. The government can buy up the surplus that is created and put it in storage. This keeps the price above Pmin. • In a bad year: The supply of coffee falls to S2. The price ceiling now becomes binding. The government can release its buffer stock from the good years on the market to increase supply and keep the price below Pmax • Obstacles: High storage costs, only works for non-perishable goods, may reduce innovation in agricultural markets S1 Pmin D
Government Intervention Blog Posts • 1.3GovernmentIntervention • Blog posts on Price Controls • Despite what we know about the inefficiency of government interventions, they are always happening. Read the blog posts below and respond to the discussion questions at the end of each post. • The problem with price controls in Europe’s agricultural markets • Price controls in the Chinese Petrol market – or why you may have to wait in line to fill your gas tank! • Letting markets work: the Malaysia fuel subsidy goes bye bye • China’s “visible hand” clamps down on rising prices • Beijing caves in to the indisputable power of the MARKET! • Will limiting exectutive pay send American business leaders packing for Europe? Probably not… • Russia goes “Mugabe” on food prices as elections approach! • So, how are those Zimbabweans doing under Mugabe’s price controls?